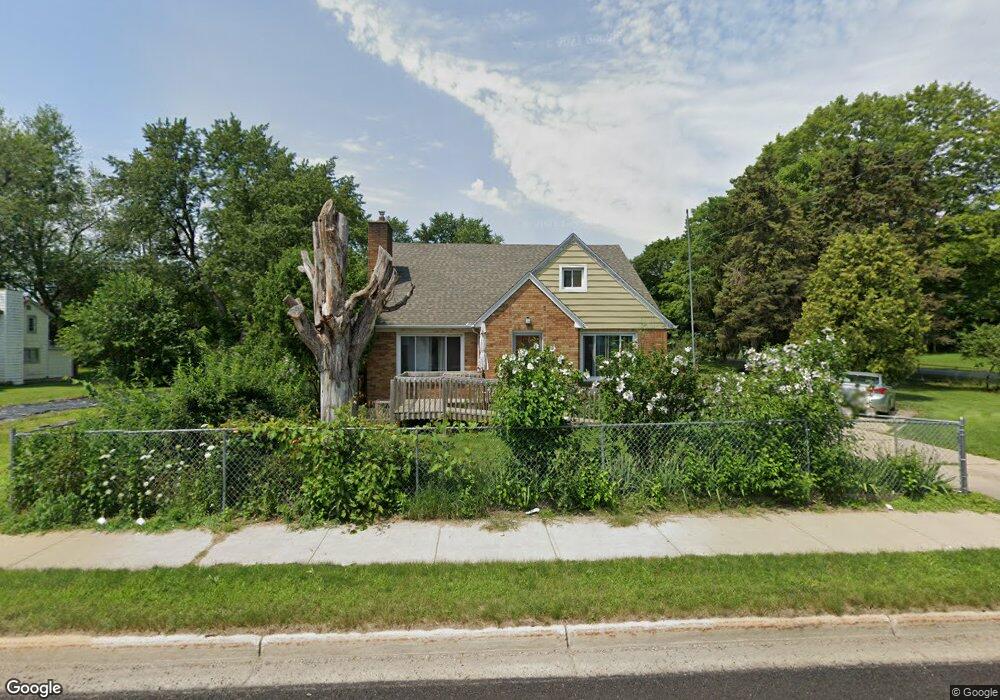
2921 Turner St Lansing, MI 48906
Creston NeighborhoodEstimated Value: $161,000 - $200,000
3
Beds
1
Bath
1,691
Sq Ft
$106/Sq Ft
Est. Value
About This Home
This home is located at 2921 Turner St, Lansing, MI 48906 and is currently estimated at $179,289, approximately $106 per square foot. 2921 Turner St is a home located in Ingham County with nearby schools including Gier Park School, Pattengill Academy, and Eastern High School.
Ownership History
Date
Name
Owned For
Owner Type
Purchase Details
Closed on
Feb 17, 2016
Sold by
Vang Bill K and Yang Shoua Ruth
Bought by
Vang Jeremy Josepj
Current Estimated Value
Purchase Details
Closed on
May 19, 2008
Sold by
Vang Bill Kenady and Vang Joanna
Bought by
Vang Bill Kenady and Yang Shova Ruth
Purchase Details
Closed on
Dec 7, 2007
Sold by
Vang Boua Chao
Bought by
Vang Bill Kenady and Vang Joanna
Purchase Details
Closed on
May 15, 2000
Sold by
Buysse Jacqueline L and Buysse James R
Bought by
Vang Boua C and Yang Choua
Home Financials for this Owner
Home Financials are based on the most recent Mortgage that was taken out on this home.
Original Mortgage
$71,900
Interest Rate
8.21%
Mortgage Type
FHA
Purchase Details
Closed on
Sep 10, 1999
Sold by
Buysse James R and Buysse Jacqueline L
Bought by
Buysse Jacqueline L and Buysse James R
Create a Home Valuation Report for This Property
The Home Valuation Report is an in-depth analysis detailing your home's value as well as a comparison with similar homes in the area
Home Values in the Area
Average Home Value in this Area
Purchase History
| Date | Buyer | Sale Price | Title Company |
|---|---|---|---|
| Vang Jeremy Josepj | -- | None Available | |
| Vang Bill Kenady | -- | None Available | |
| Vang Bill Kenady | -- | None Available | |
| Vang Boua C | $72,000 | -- | |
| Buysse Jacqueline L | -- | -- |
Source: Public Records
Mortgage History
| Date | Status | Borrower | Loan Amount |
|---|---|---|---|
| Previous Owner | Vang Boua C | $71,900 | |
| Closed | Vang Boua C | $4,100 |
Source: Public Records
Tax History
| Year | Tax Paid | Tax Assessment Tax Assessment Total Assessment is a certain percentage of the fair market value that is determined by local assessors to be the total taxable value of land and additions on the property. | Land | Improvement |
|---|---|---|---|---|
| 2025 | $3,265 | $80,800 | $7,800 | $73,000 |
| 2024 | $3,072 | $81,600 | $7,800 | $73,800 |
| 2023 | $3,072 | $70,600 | $7,800 | $62,800 |
| 2022 | $2,804 | $39,300 | $8,800 | $30,500 |
| 2021 | $2,739 | $35,500 | $8,300 | $27,200 |
| 2020 | $2,720 | $34,500 | $8,300 | $26,200 |
| 2019 | $2,644 | $33,000 | $8,300 | $24,700 |
| 2018 | $2,608 | $33,100 | $8,300 | $24,800 |
| 2017 | $2,510 | $33,100 | $8,300 | $24,800 |
| 2016 | $1,731 | $32,600 | $8,300 | $24,300 |
| 2015 | $1,731 | $31,100 | $16,538 | $14,562 |
| 2014 | $1,731 | $30,400 | $17,719 | $12,681 |
Source: Public Records
Map
Nearby Homes
- 2701 Creston Ave
- 504 W Fairfield Ave
- 2403 Turner St
- 310 W Frederick Ave
- 3425 Turner Rd
- 627 W Frederick Ave
- 2610 Gary Ave
- 205 E Thomas St
- 213 E Thomas St
- 200 Mosley Ave
- 16967 Jones Lake Rd
- 714 W Sheridan Rd
- 2729 N Martin Luther King jr Blvd
- 331 Douglas Ave
- 134 Desander Dr Unit 134
- 82 Nettie Ave Unit 82
- 86 Nettie Ave Unit 86
- 93 Nettie Ave Unit 93
- 92 Nettie Ave Unit 92
- 1344 Marquette St
- 2915 Turner St
- 2907 Turner St
- 2901 Turner St
- 2910 Turner St Unit Bldg-Unit
- 2910 Turner St
- 2922 Turner St
- 2900 Turner St
- 325 W Howe Ave
- 3002 Turner St
- 3002 Turner Rd
- 3011 Turner Rd
- 405 W Howe Ave
- 2819 Turner St
- 3011 Turner St
- 2818 Turner St
- 324 W Howe Ave
- 3008 Turner Rd
- 2808 Turner Rd
- 3017 Turner St
- 2808 Turner St
Your Personal Tour Guide
Ask me questions while you tour the home.