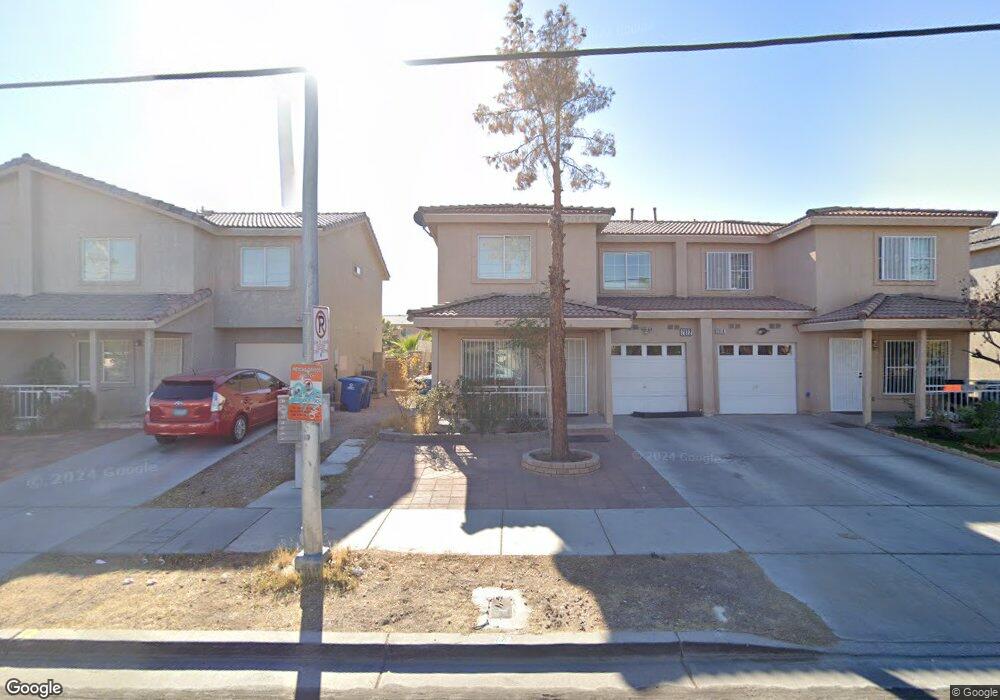
2922 Cedar Ave Las Vegas, NV 89101
East Las Vegas NeighborhoodEstimated Value: $259,000 - $291,000
3
Beds
3
Baths
1,304
Sq Ft
$211/Sq Ft
Est. Value
About This Home
This home is located at 2922 Cedar Ave, Las Vegas, NV 89101 and is currently estimated at $275,079, approximately $210 per square foot. 2922 Cedar Ave is a home located in Clark County with nearby schools including Sunrise Acres Elementary School, Roy West Martin Middle School, and Desert Pines High School.
Ownership History
Date
Name
Owned For
Owner Type
Purchase Details
Closed on
Dec 1, 2016
Sold by
Arroya Nohemi Garcia
Bought by
Ramos Eliezer L Urquilla and Lopez Ruth E
Current Estimated Value
Home Financials for this Owner
Home Financials are based on the most recent Mortgage that was taken out on this home.
Original Mortgage
$115,862
Outstanding Balance
$96,007
Interest Rate
4.4%
Mortgage Type
FHA
Estimated Equity
$179,072
Purchase Details
Closed on
Jul 22, 2016
Sold by
Mtc Financial Inc
Bought by
Arroyo Nohemi Garcia
Purchase Details
Closed on
Jun 25, 2001
Sold by
East Las Vegas Community Outreach
Bought by
Nunez Antonio Cruz
Home Financials for this Owner
Home Financials are based on the most recent Mortgage that was taken out on this home.
Original Mortgage
$92,276
Interest Rate
6.99%
Create a Home Valuation Report for This Property
The Home Valuation Report is an in-depth analysis detailing your home's value as well as a comparison with similar homes in the area
Home Values in the Area
Average Home Value in this Area
Purchase History
| Date | Buyer | Sale Price | Title Company |
|---|---|---|---|
| Ramos Eliezer L Urquilla | $118,000 | Chicago Title | |
| Arroyo Nohemi Garcia | $446 | None Available | |
| Nunez Antonio Cruz | $111,276 | Stewart Title Company |
Source: Public Records
Mortgage History
| Date | Status | Borrower | Loan Amount |
|---|---|---|---|
| Open | Ramos Eliezer L Urquilla | $115,862 | |
| Previous Owner | Nunez Antonio Cruz | $92,276 | |
| Closed | Nunez Antonio Cruz | $24,297 |
Source: Public Records
Tax History Compared to Growth
Tax History
| Year | Tax Paid | Tax Assessment Tax Assessment Total Assessment is a certain percentage of the fair market value that is determined by local assessors to be the total taxable value of land and additions on the property. | Land | Improvement |
|---|---|---|---|---|
| 2025 | $576 | $64,355 | $17,850 | $46,505 |
| 2024 | $560 | $64,355 | $17,850 | $46,505 |
| 2023 | $931 | $61,853 | $19,250 | $42,603 |
| 2022 | $596 | $56,161 | $15,750 | $40,411 |
| 2021 | $552 | $44,329 | $11,200 | $33,129 |
| 2020 | $509 | $43,196 | $8,750 | $34,446 |
| 2019 | $477 | $42,957 | $8,750 | $34,207 |
| 2018 | $456 | $38,257 | $5,600 | $32,657 |
| 2017 | $1,017 | $31,024 | $4,900 | $26,124 |
| 2016 | $931 | $36,095 | $3,500 | $32,595 |
| 2015 | $426 | $17,566 | $3,500 | $14,066 |
| 2014 | $413 | $14,967 | $2,450 | $12,517 |
Source: Public Records
Map
Nearby Homes
- 2915 Cedar Ave Unit 11C
- 506 Wardelle St Unit C
- 2812 Marlin Ave
- 520 N 28th St
- 2645 Cedar Ave
- 2516 E Mesquite Ave
- 2513 Cedar Ave
- 2600 E Bonanza Rd
- 0 Mcknight St
- 2218 E Mesquite Ave
- 920 E Bonanza Rd
- 802 Stewart Ave
- 2408 Berkley Ave
- 2528 Sunrise Ave
- 50 N 27th St
- 921 Delta St
- 2538 Valley St
- 2016 Linden Ave
- 2020 E Bonanza Rd
- 209 N 21st St
- 2926 Cedar Ave
- 2918 Cedar Ave
- 2930 Cedar Ave
- 2914 Cedar Ave
- 2934 Cedar Ave
- 2910 Cedar Ave
- 2938 Cedar Ave
- 2923 Poplar Ave
- 2919 Poplar Ave
- 2942 Cedar Ave
- 2927 Poplar Ave
- 2902 Cedar Ave
- 2915 Poplar Ave
- 2931 Poplar Ave
- 2911 Poplar Ave
- 2935 Poplar Ave
- 2907 Poplar Ave
- 2946 Cedar Ave
- 2901 Cedar Ave Unit 101A
- 2939 Poplar Ave