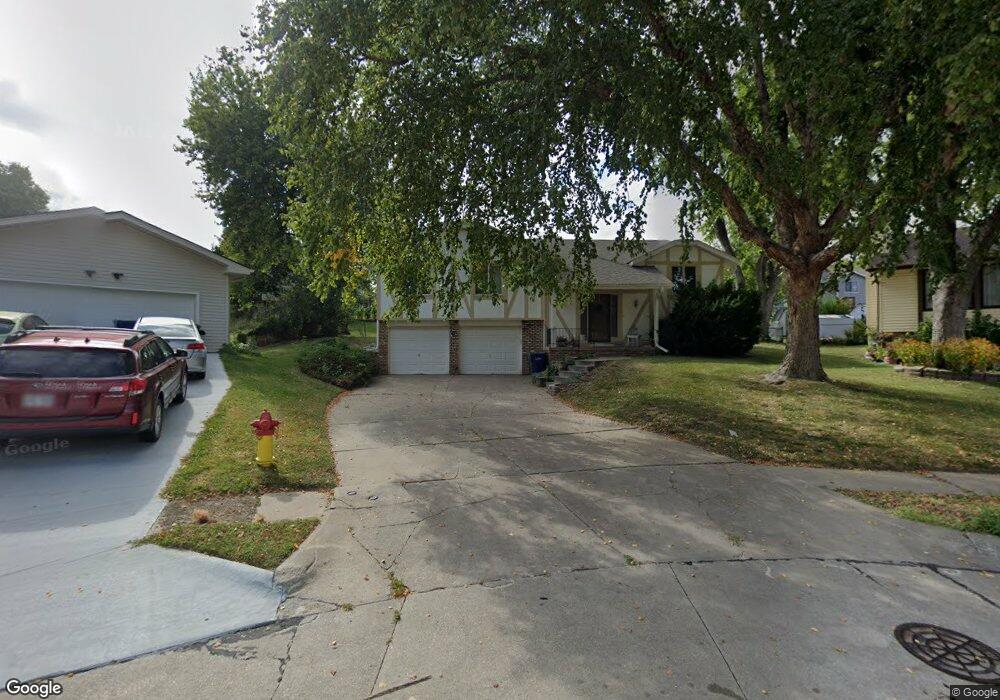
2922 Daniell Cir Bellevue, NE 68123
Estimated Value: $292,000 - $314,000
3
Beds
3
Baths
1,465
Sq Ft
$205/Sq Ft
Est. Value
About This Home
This home is located at 2922 Daniell Cir, Bellevue, NE 68123 and is currently estimated at $300,727, approximately $205 per square foot. 2922 Daniell Cir is a home located in Sarpy County with nearby schools including Leonard Lawrence Elementary School, Lewis & Clark Middle School, and Bellevue West High School.
Ownership History
Date
Name
Owned For
Owner Type
Purchase Details
Closed on
Apr 26, 2013
Sold by
Watkins Richard L and Watkins Frankie M
Bought by
Watkins Richard L and Watkins Frankie M
Current Estimated Value
Purchase Details
Closed on
May 19, 2005
Sold by
Simon Thomas Michael and Simon Michele Louise
Bought by
Watkins Richard L and Watkins Frankie
Purchase Details
Closed on
Jun 4, 2001
Sold by
Secretary Of Veterans Affairs
Bought by
Simon Thomas Michael and Simon Michele Louise
Home Financials for this Owner
Home Financials are based on the most recent Mortgage that was taken out on this home.
Original Mortgage
$116,350
Outstanding Balance
$44,190
Interest Rate
7.1%
Estimated Equity
$256,537
Purchase Details
Closed on
Nov 20, 2000
Sold by
Mcgaugh Richard B and Briggs Barbara
Bought by
Va
Create a Home Valuation Report for This Property
The Home Valuation Report is an in-depth analysis detailing your home's value as well as a comparison with similar homes in the area
Home Values in the Area
Average Home Value in this Area
Purchase History
| Date | Buyer | Sale Price | Title Company |
|---|---|---|---|
| Watkins Richard L | -- | None Available | |
| Watkins Richard L | $137,000 | -- | |
| Simon Thomas Michael | -- | -- | |
| Va | $94,755 | -- |
Source: Public Records
Mortgage History
| Date | Status | Borrower | Loan Amount |
|---|---|---|---|
| Open | Simon Thomas Michael | $116,350 |
Source: Public Records
Tax History Compared to Growth
Tax History
| Year | Tax Paid | Tax Assessment Tax Assessment Total Assessment is a certain percentage of the fair market value that is determined by local assessors to be the total taxable value of land and additions on the property. | Land | Improvement |
|---|---|---|---|---|
| 2025 | $4,294 | $262,896 | $46,000 | $216,896 |
| 2024 | $4,826 | $246,526 | $44,000 | $202,526 |
| 2023 | $4,826 | $228,560 | $39,000 | $189,560 |
| 2022 | $4,418 | $205,279 | $35,000 | $170,279 |
| 2021 | $4,093 | $188,172 | $30,000 | $158,172 |
| 2020 | $3,904 | $178,923 | $30,000 | $148,923 |
| 2019 | $3,747 | $172,770 | $30,000 | $142,770 |
| 2018 | $3,369 | $159,533 | $25,000 | $134,533 |
| 2017 | $3,251 | $152,897 | $25,000 | $127,897 |
| 2016 | $3,068 | $147,454 | $25,000 | $122,454 |
| 2015 | $2,971 | $143,667 | $25,000 | $118,667 |
| 2014 | $2,838 | $136,320 | $25,000 | $111,320 |
| 2012 | -- | $138,243 | $25,000 | $113,243 |
Source: Public Records
Map
Nearby Homes
- 2940 Leawood Dr
- 3102 Redwing Dr
- 12901 S 29th Place
- 3105 Leawood Dr
- 3108 Mirror Cir
- 12722 S 28th Ave
- 3105 Mirror Cir
- 13403 S 28th St
- 2512 Nottingham Dr
- 3309 Lookingglass Dr
- 3506 Lynnwood Dr
- 2923 Blackhawk Dr
- 3504 Sheridan Cir
- 12915 Forestdale Dr
- 3508 Jason Cir
- 12750 Forestdale Dr
- 3728 Schuemann Dr
- 12741 Ridgeview Cir
- 3738 Falcon Dr
- 3716 Lookingglass Dr
- 2919 Daniell Cir
- 13003 S 29th Ave
- 2920 Daniell Cir
- 13001 S 29th Ave
- 13001 S 29th Ave
- 13005 S 29th Ave
- 12911 S 29th Ave
- 2917 Daniell Cir
- 2918 Daniell Cir
- 13007 S 29th Ave
- 2915 Daniell Cir
- 2916 Daniell Cir
- 12909 S 29th Ave
- 2926 Lynnwood Dr
- 2926 Lynnwood
- 2924 Lynnwood Dr
- 2917 Redwing Cir
- 12907 S 29th Ave
- 2928 Lynnwood Dr
- 13004 S 29th Ave