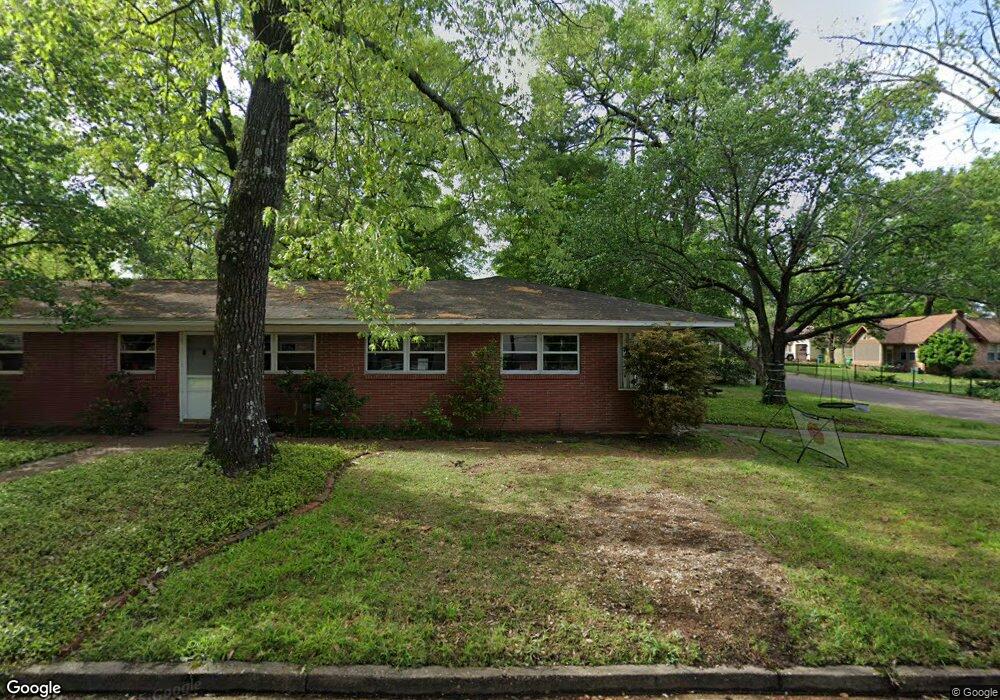
2922 Main St Texarkana, TX 75503
Estimated Value: $181,000 - $233,000
--
Bed
--
Bath
2,294
Sq Ft
$87/Sq Ft
Est. Value
About This Home
This home is located at 2922 Main St, Texarkana, TX 75503 and is currently estimated at $198,819, approximately $86 per square foot. 2922 Main St is a home located in Bowie County with nearby schools including Highland Park Elementary School, Texas Middle School, and Texas High School.
Ownership History
Date
Name
Owned For
Owner Type
Purchase Details
Closed on
Nov 10, 2023
Sold by
Roy Seymour Family Limited Partnership
Bought by
Nason Jennifer and Nason Christopher
Current Estimated Value
Home Financials for this Owner
Home Financials are based on the most recent Mortgage that was taken out on this home.
Original Mortgage
$138,000
Outstanding Balance
$131,849
Interest Rate
7.49%
Mortgage Type
New Conventional
Estimated Equity
$66,970
Purchase Details
Closed on
Feb 28, 2014
Sold by
Williams Ronald David
Bought by
Dorsey Micah Aaron
Home Financials for this Owner
Home Financials are based on the most recent Mortgage that was taken out on this home.
Original Mortgage
$106,043
Interest Rate
4.12%
Mortgage Type
FHA
Create a Home Valuation Report for This Property
The Home Valuation Report is an in-depth analysis detailing your home's value as well as a comparison with similar homes in the area
Home Values in the Area
Average Home Value in this Area
Purchase History
| Date | Buyer | Sale Price | Title Company |
|---|---|---|---|
| Nason Jennifer | -- | None Listed On Document | |
| Dorsey Micah Aaron | -- | Stewart Title |
Source: Public Records
Mortgage History
| Date | Status | Borrower | Loan Amount |
|---|---|---|---|
| Open | Nason Jennifer | $138,000 | |
| Previous Owner | Dorsey Micah Aaron | $106,043 |
Source: Public Records
Tax History Compared to Growth
Tax History
| Year | Tax Paid | Tax Assessment Tax Assessment Total Assessment is a certain percentage of the fair market value that is determined by local assessors to be the total taxable value of land and additions on the property. | Land | Improvement |
|---|---|---|---|---|
| 2025 | $2,766 | $184,325 | $10,000 | $174,325 |
| 2024 | $2,766 | $173,738 | $10,000 | $169,467 |
| 2023 | $3,740 | $157,944 | $0 | $0 |
| 2022 | $3,427 | $153,930 | $10,000 | $143,930 |
| 2021 | $3,338 | $130,532 | $10,000 | $120,532 |
| 2020 | $3,215 | $125,064 | $10,000 | $115,064 |
| 2019 | $3,197 | $119,855 | $10,000 | $109,855 |
| 2018 | $3,090 | $115,846 | $10,000 | $105,846 |
| 2017 | $2,941 | $110,563 | $10,000 | $100,563 |
| 2016 | $2,868 | $107,802 | $10,000 | $97,802 |
| 2015 | $2,742 | $106,889 | $10,000 | $96,889 |
| 2014 | $2,742 | $106,003 | $10,000 | $96,003 |
Source: Public Records
Map
Nearby Homes