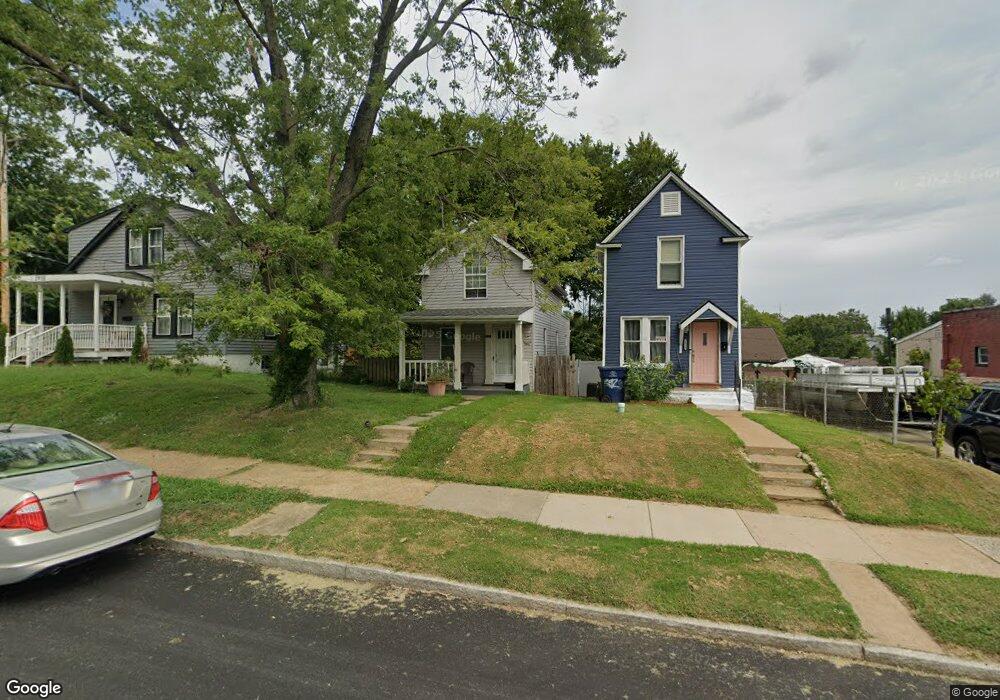
2922 Tamm Ave Saint Louis, MO 63139
Clifton Heights NeighborhoodEstimated Value: $214,157 - $258,000
3
Beds
1
Bath
1,231
Sq Ft
$194/Sq Ft
Est. Value
About This Home
This home is located at 2922 Tamm Ave, Saint Louis, MO 63139 and is currently estimated at $239,039, approximately $194 per square foot. 2922 Tamm Ave is a home located in St. Louis City with nearby schools including Mason Elementary School, Long International Middle School, and Roosevelt High School.
Ownership History
Date
Name
Owned For
Owner Type
Purchase Details
Closed on
Oct 11, 2016
Sold by
Collins Timothy and Collins Patricia
Bought by
Collins Timothy W and Collins Patricia
Current Estimated Value
Home Financials for this Owner
Home Financials are based on the most recent Mortgage that was taken out on this home.
Original Mortgage
$94,500
Outstanding Balance
$75,604
Interest Rate
3.48%
Mortgage Type
New Conventional
Estimated Equity
$163,435
Purchase Details
Closed on
Oct 7, 2015
Sold by
Collins Timothy and Collins Patricia
Bought by
Collins Timothy and Collins Patricia
Purchase Details
Closed on
Apr 2, 2013
Sold by
Wells Fargo Bank Na
Bought by
Collins Timothy and Collins Patricia
Purchase Details
Closed on
Mar 26, 2013
Sold by
Minor Larry E
Bought by
Wells Fargo Bank Na
Purchase Details
Closed on
Jan 16, 2002
Sold by
Seim Roland and Seim Glenda
Bought by
Minor Larry E
Home Financials for this Owner
Home Financials are based on the most recent Mortgage that was taken out on this home.
Original Mortgage
$72,856
Interest Rate
7.07%
Mortgage Type
FHA
Create a Home Valuation Report for This Property
The Home Valuation Report is an in-depth analysis detailing your home's value as well as a comparison with similar homes in the area
Home Values in the Area
Average Home Value in this Area
Purchase History
| Date | Buyer | Sale Price | Title Company |
|---|---|---|---|
| Collins Timothy W | -- | None Available | |
| Collins Timothy | -- | None Available | |
| Collins Timothy | -- | Service Link | |
| Wells Fargo Bank Na | $59,021 | None Available | |
| Minor Larry E | -- | -- |
Source: Public Records
Mortgage History
| Date | Status | Borrower | Loan Amount |
|---|---|---|---|
| Open | Collins Timothy W | $94,500 | |
| Previous Owner | Minor Larry E | $72,856 |
Source: Public Records
Tax History Compared to Growth
Tax History
| Year | Tax Paid | Tax Assessment Tax Assessment Total Assessment is a certain percentage of the fair market value that is determined by local assessors to be the total taxable value of land and additions on the property. | Land | Improvement |
|---|---|---|---|---|
| 2025 | $1,495 | $20,990 | $1,790 | $19,200 |
| 2024 | $1,423 | $17,530 | $1,790 | $15,740 |
| 2023 | $1,423 | $17,530 | $1,790 | $15,740 |
| 2022 | $1,308 | $15,480 | $1,790 | $13,690 |
| 2021 | $1,306 | $15,480 | $1,790 | $13,690 |
| 2020 | $1,184 | $14,120 | $1,790 | $12,330 |
| 2019 | $1,180 | $14,120 | $1,790 | $12,330 |
| 2018 | $1,065 | $12,320 | $1,790 | $10,530 |
| 2017 | $1,047 | $12,310 | $1,790 | $10,530 |
| 2016 | $979 | $11,340 | $1,790 | $9,560 |
| 2015 | $889 | $11,350 | $1,790 | $9,560 |
| 2014 | $864 | $11,350 | $1,790 | $9,560 |
| 2013 | -- | $11,020 | $1,790 | $9,230 |
Source: Public Records
Map
Nearby Homes
- 6445 Odell St
- 6266 Marmaduke Ave
- 6537 Marmaduke Ave
- 6439 Arsenal St
- 6547 Marmaduke Ave
- 6285 Magnolia Ave
- 6568 Odell St
- 6426 Arsenal St
- 6541 Southwest Ave
- 6215 Columbia Ave
- 2817 Knox Ct
- 6133 Magnolia Ave
- 6627 Arsenal St
- 6140 Columbia Ave
- 6012 Odell St
- 6568 Smiley Ave
- 6020 Southwest Ave
- 6023 Arsenal St
- 6036 Arsenal St
- 5977 Arsenal St
- 2918 Tamm Ave
- 2930 Tamm Ave
- 6401 Odell St
- 2926 Tamm Ave
- 6291 Odell St
- 6287 Odell St
- 6427 Odell St
- 2900 Tamm Ave
- 6296 Marmaduke Ave
- 6292 Marmaduke Ave
- 6298 Marmaduke Ave
- 6283 Odell St
- 6290 Marmaduke Ave
- 6420 Marmaduke Ave
- 6279 Odell St
- 6286 Marmaduke Ave
- 6437 Odell St
- 3001 Tamm Ave
- 6416 Odell St
- 6418 Odell St