Estimated Value: $145,000 - $167,019
2
Beds
1
Bath
876
Sq Ft
$179/Sq Ft
Est. Value
About This Home
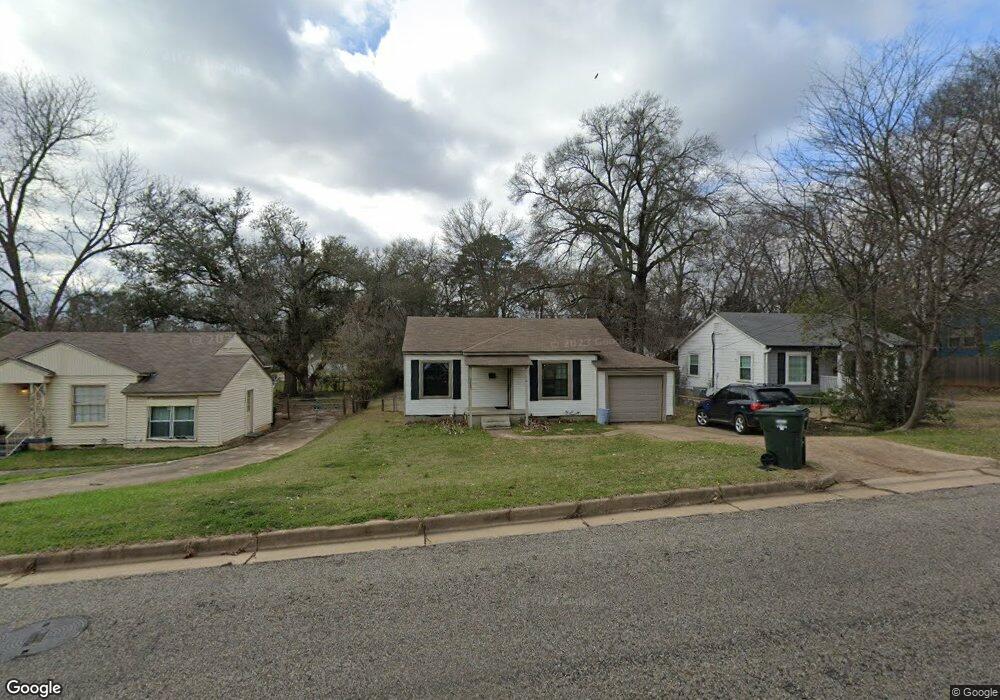
This home is located at 2923 New Copeland Rd, Tyler, TX 75701 and is currently estimated at $157,006, approximately $179 per square foot. 2923 New Copeland Rd is a home located in Smith County with nearby schools including Woods Elementary School, Hubbard Middle School, and Tyler Legacy High School.
Ownership History
Date
Name
Owned For
Owner Type
Purchase Details
Closed on
Apr 5, 2025
Sold by
Maxima Interests Limited Partnership
Bought by
Deleon Carlos
Current Estimated Value
Home Financials for this Owner
Home Financials are based on the most recent Mortgage that was taken out on this home.
Original Mortgage
$113,000
Outstanding Balance
$111,410
Interest Rate
6.76%
Mortgage Type
New Conventional
Estimated Equity
$45,596
Purchase Details
Closed on
Aug 5, 2008
Sold by
Hardy Willie J and Hardy Franeita B
Bought by
Maxima Interests Limited Partnership
Purchase Details
Closed on
Jun 28, 2006
Sold by
Butler Jo Nell
Bought by
Hardy Willie J and Hardy Franeita B
Home Financials for this Owner
Home Financials are based on the most recent Mortgage that was taken out on this home.
Original Mortgage
$100,000
Interest Rate
6.67%
Mortgage Type
Credit Line Revolving
Create a Home Valuation Report for This Property
The Home Valuation Report is an in-depth analysis detailing your home's value as well as a comparison with similar homes in the area
Purchase History
| Date | Buyer | Sale Price | Title Company |
|---|---|---|---|
| Deleon Carlos | -- | None Listed On Document | |
| Maxima Interests Limited Partnership | -- | None Available | |
| Hardy Willie J | -- | None Available |
Source: Public Records
Mortgage History
| Date | Status | Borrower | Loan Amount |
|---|---|---|---|
| Open | Deleon Carlos | $113,000 | |
| Previous Owner | Hardy Willie J | $100,000 |
Source: Public Records
Tax History
| Year | Tax Paid | Tax Assessment Tax Assessment Total Assessment is a certain percentage of the fair market value that is determined by local assessors to be the total taxable value of land and additions on the property. | Land | Improvement |
|---|---|---|---|---|
| 2025 | $1,563 | $91,845 | $32,106 | $59,739 |
| 2024 | $1,712 | $100,609 | $20,985 | $79,624 |
| 2023 | $1,764 | $101,184 | $20,985 | $80,199 |
| 2022 | $1,469 | $75,000 | $19,166 | $55,834 |
| 2021 | $1,110 | $52,895 | $19,166 | $33,729 |
| 2020 | $1,122 | $52,420 | $19,166 | $33,254 |
| 2019 | $1,208 | $55,252 | $19,166 | $36,086 |
| 2018 | $1,069 | $49,143 | $13,990 | $35,153 |
| 2017 | $1,049 | $49,157 | $13,990 | $35,167 |
| 2016 | $976 | $45,712 | $13,990 | $31,722 |
| 2015 | $957 | $44,679 | $13,990 | $30,689 |
| 2014 | $957 | $45,032 | $13,990 | $31,042 |
Source: Public Records
Map
Nearby Homes
- 2904 New Copeland Rd
- 2819 New Copeland Rd
- 2916 Crestview Ave
- 2713 S Donnybrook Ave
- 2721 S Donnybrook Ave
- 2717 S Donnybrook Ave
- 2707 S Donnybrook Ave
- 329 Wilma St
- 349 Wilma St
- 414 Wilma St
- 2701 S Donnybrook Ave
- 317 Amberwood Cir
- 3126 Colgate Ave
- 921 E Barbara St
- 901 Rhodes Dr
- 3828 Cr 219
- 1018 Pollard Dr
- 0 S Donnybrook Ave
- 3140 Bracken Dr
- 2521 Pounds Ave
- 2915 New Copeland Rd
- 2927 2927 Copeland Rd
- 2909 New Copeland Rd
- 2931 New Copeland Rd
- 2916 Crestview St
- 2926 Crestview St
- 2914 Crestview St
- 2937 New Copeland Rd
- 2903 New Copeland Rd
- 2912 New Copeland Rd
- 2916 2916 Crestview
- 2912 2912 New Copeland
- 2926 2926 Crestview
- 2912 Crestview St
- 2930 Crestview St
- 2924 New Copeland Rd
- 3003 New Copeland Rd
- 3003 3003 Copeland Rd
- 0 S Vine Unit 29342199
- 503 503 Commons Dr
Your Personal Tour Guide
Ask me questions while you tour the home.