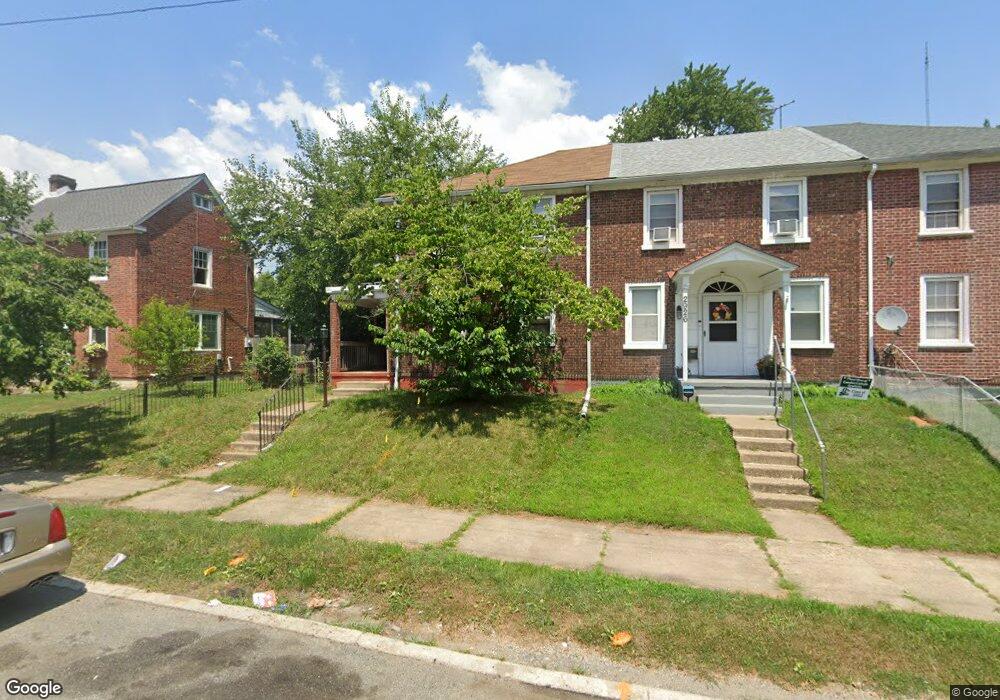
2924 N Constitution Rd Camden, NJ 08104
Fairview NeighborhoodEstimated Value: $150,000 - $186,000
--
Bed
--
Bath
1,293
Sq Ft
$128/Sq Ft
Est. Value
About This Home
This home is located at 2924 N Constitution Rd, Camden, NJ 08104 and is currently estimated at $165,808, approximately $128 per square foot. 2924 N Constitution Rd is a home located in Camden County with nearby schools including Yorkship Elementary School and Camden High School.
Ownership History
Date
Name
Owned For
Owner Type
Purchase Details
Closed on
Apr 4, 2002
Sold by
Figueroa Jose
Bought by
Smith Kenneth Leon
Current Estimated Value
Home Financials for this Owner
Home Financials are based on the most recent Mortgage that was taken out on this home.
Original Mortgage
$61,017
Outstanding Balance
$25,961
Interest Rate
7.18%
Mortgage Type
FHA
Estimated Equity
$139,847
Purchase Details
Closed on
Nov 30, 2001
Sold by
Washington Mutual
Bought by
Figueroa Jose and Figueroa Evelyn
Home Financials for this Owner
Home Financials are based on the most recent Mortgage that was taken out on this home.
Original Mortgage
$22,950
Interest Rate
7.08%
Purchase Details
Closed on
Oct 24, 1997
Sold by
Naulty Joseph
Bought by
Perez Marilyn J and Paganas Herminio
Home Financials for this Owner
Home Financials are based on the most recent Mortgage that was taken out on this home.
Original Mortgage
$43,000
Interest Rate
7.23%
Mortgage Type
FHA
Create a Home Valuation Report for This Property
The Home Valuation Report is an in-depth analysis detailing your home's value as well as a comparison with similar homes in the area
Home Values in the Area
Average Home Value in this Area
Purchase History
| Date | Buyer | Sale Price | Title Company |
|---|---|---|---|
| Smith Kenneth Leon | $61,500 | -- | |
| Figueroa Jose | $25,500 | -- | |
| Perez Marilyn J | $43,000 | -- |
Source: Public Records
Mortgage History
| Date | Status | Borrower | Loan Amount |
|---|---|---|---|
| Open | Smith Kenneth Leon | $61,017 | |
| Previous Owner | Figueroa Jose | $22,950 | |
| Previous Owner | Perez Marilyn J | $43,000 |
Source: Public Records
Tax History Compared to Growth
Tax History
| Year | Tax Paid | Tax Assessment Tax Assessment Total Assessment is a certain percentage of the fair market value that is determined by local assessors to be the total taxable value of land and additions on the property. | Land | Improvement |
|---|---|---|---|---|
| 2025 | $2,523 | $71,200 | $18,300 | $52,900 |
| 2024 | $2,439 | $71,200 | $18,300 | $52,900 |
| 2023 | $2,439 | $71,200 | $18,300 | $52,900 |
| 2022 | $2,393 | $71,200 | $18,300 | $52,900 |
| 2021 | $2,384 | $71,200 | $18,300 | $52,900 |
| 2020 | $2,264 | $71,200 | $18,300 | $52,900 |
| 2019 | $2,168 | $71,200 | $18,300 | $52,900 |
| 2018 | $2,157 | $71,200 | $18,300 | $52,900 |
| 2017 | $2,104 | $71,200 | $18,300 | $52,900 |
| 2016 | $2,037 | $71,200 | $18,300 | $52,900 |
| 2015 | $1,961 | $71,200 | $18,300 | $52,900 |
| 2014 | $1,914 | $71,200 | $18,300 | $52,900 |
Source: Public Records
Map
Nearby Homes
- 1333 Argus Rd
- 2931 N Constitution Rd
- 1433 N Chesapeake Rd
- 2845 N Constitution Rd
- 3079 Alabama Rd
- 3069 S Chesapeake Rd
- 2930 N Merrimac Rd
- 3044 N Merrimac Rd
- 2909 Yorkship Rd
- 2828 Yorkship Rd Unit 1
- 1261 S Merrimac Rd
- 1316 S Merrimac Rd
- 1300 S Merrimac Rd
- 3156 Alabama Rd
- 1623 Olympia Rd
- 2870 Kansas Rd
- 2682 N Congress Rd
- 3069 S Congress Rd
- 1065 Ironside Rd
- 3120 S Constitution Rd
- 2926 N Constitution Rd
- 2916 N Constitution Rd
- 2928 N Constitution Rd
- 2912 N Constitution Rd
- 2934 N Constitution Rd
- 2910 N Constitution Rd
- 2927 N Congress Rd
- 2925 N Congress Rd
- 2923 N Congress Rd
- 2936 N Constitution Rd
- 2935 N Congress Rd
- 2921 N Congress Rd
- 2906 N Constitution Rd
- 2917 N Congress Rd
- 2917 N Constitution Rd
- 2938 N Constitution Rd
- 2943 N Congress Rd
- 2915 N Congress Rd
- 2919 N Constitution Rd
- 2945 N Congress Rd