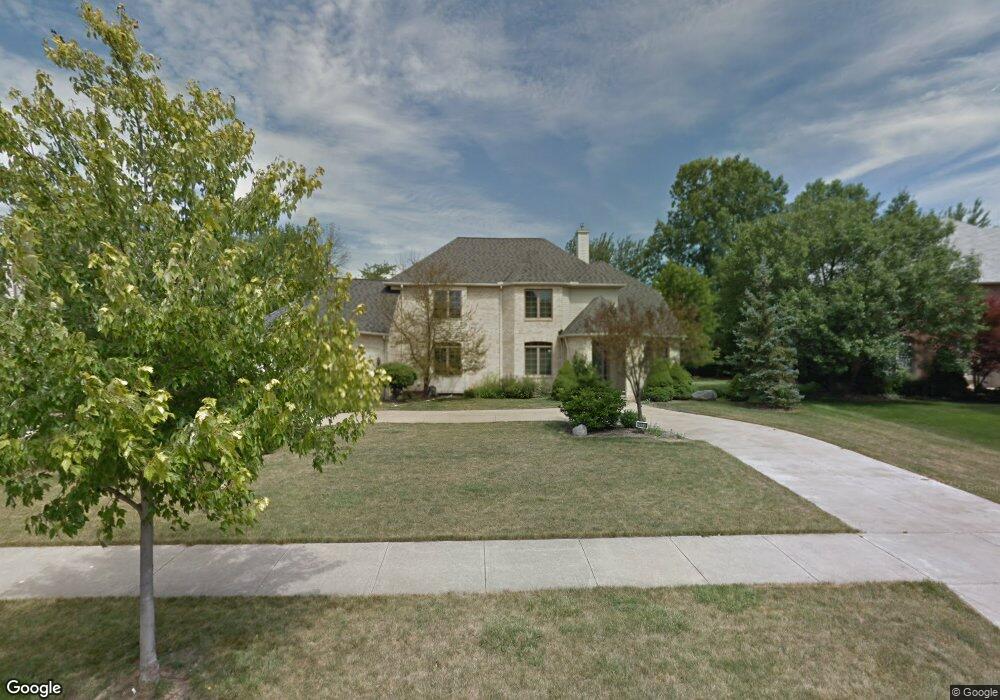
29248 Regency Cir Westlake, OH 44145
Estimated Value: $642,000 - $832,000
4
Beds
4
Baths
3,527
Sq Ft
$210/Sq Ft
Est. Value
About This Home
This home is located at 29248 Regency Cir, Westlake, OH 44145 and is currently estimated at $742,403, approximately $210 per square foot. 29248 Regency Cir is a home located in Cuyahoga County with nearby schools including Dover Intermediate School, Lee Burneson Middle School, and Westlake High School.
Ownership History
Date
Name
Owned For
Owner Type
Purchase Details
Closed on
Dec 31, 1997
Sold by
Christopher Dev Corp
Bought by
Mona Ali and Mona Abdul
Current Estimated Value
Home Financials for this Owner
Home Financials are based on the most recent Mortgage that was taken out on this home.
Original Mortgage
$235,500
Outstanding Balance
$41,378
Interest Rate
7.28%
Mortgage Type
New Conventional
Estimated Equity
$701,025
Purchase Details
Closed on
Mar 27, 1997
Sold by
David Mccrone Builders I
Bought by
Christopher Dev Corp
Home Financials for this Owner
Home Financials are based on the most recent Mortgage that was taken out on this home.
Original Mortgage
$281,500
Interest Rate
7.73%
Mortgage Type
Balloon
Purchase Details
Closed on
Mar 22, 1996
Sold by
Kopf Const Corp
Bought by
David Mccrone Builders Inc
Home Financials for this Owner
Home Financials are based on the most recent Mortgage that was taken out on this home.
Original Mortgage
$171,750
Interest Rate
7.06%
Mortgage Type
New Conventional
Purchase Details
Closed on
Jan 1, 1994
Bought by
Koft Const Corp
Create a Home Valuation Report for This Property
The Home Valuation Report is an in-depth analysis detailing your home's value as well as a comparison with similar homes in the area
Home Values in the Area
Average Home Value in this Area
Purchase History
| Date | Buyer | Sale Price | Title Company |
|---|---|---|---|
| Mona Ali | $307,000 | -- | |
| Christopher Dev Corp | $105,000 | -- | |
| David Mccrone Builders Inc | $76,500 | -- | |
| Koft Const Corp | -- | -- |
Source: Public Records
Mortgage History
| Date | Status | Borrower | Loan Amount |
|---|---|---|---|
| Open | Mona Ali | $235,500 | |
| Previous Owner | Christopher Dev Corp | $281,500 | |
| Previous Owner | David Mccrone Builders Inc | $171,750 |
Source: Public Records
Tax History Compared to Growth
Tax History
| Year | Tax Paid | Tax Assessment Tax Assessment Total Assessment is a certain percentage of the fair market value that is determined by local assessors to be the total taxable value of land and additions on the property. | Land | Improvement |
|---|---|---|---|---|
| 2024 | $9,796 | $206,780 | $55,125 | $151,655 |
| 2023 | $9,238 | $166,710 | $47,220 | $119,490 |
| 2022 | $9,090 | $166,705 | $47,215 | $119,490 |
| 2021 | $9,101 | $166,710 | $47,220 | $119,490 |
| 2020 | $10,588 | $177,910 | $46,310 | $131,600 |
| 2019 | $10,266 | $508,300 | $132,300 | $376,000 |
| 2018 | $9,600 | $177,910 | $46,310 | $131,600 |
| 2017 | $8,984 | $145,780 | $44,770 | $101,010 |
| 2016 | $8,936 | $145,780 | $44,770 | $101,010 |
| 2015 | $8,128 | $145,780 | $44,770 | $101,010 |
| 2014 | $8,128 | $130,170 | $39,970 | $90,200 |
Source: Public Records
Map
Nearby Homes
- 29579 Devonshire Oval
- 28360 Center Ridge Rd Unit 226
- 28340 Center Ridge Rd Unit 123
- 28080 Center Ridge Rd
- 3115 Bay Landing Dr Unit 3115
- 3450 Briar Ridge Ct Unit F
- 3152 Bay Landing Dr
- 2995 N Bay Dr Unit I14
- 28744 Woodmill Dr
- 2820 N Bay Dr
- 29772 Hilliard Oak Ln
- 3263 Bay Landing Dr Unit 27
- 3283 Bay Landing Dr Unit 3283
- 28152 Sherwood Dr
- 27387 Westown Blvd Unit 1404
- 1900 Sperrys Forge Trail
- 29458 Hummingbird Cir Unit 71
- 3222 Balsam Dr
- 27413 Westown Blvd Unit 1605
- 27413 Westown Blvd Unit 1607
- 29252 Regency Cir
- 29244 Regency Cir
- 29249 Grande Ct
- 29256 Regency Cir
- 29240 Regency Cir
- 29241 Regency Cir
- 29254 Grande Ct
- 29260 Regency Cir
- 29236 Regency Cir
- 29261 Grande Ct
- 29229 Regency Cir
- 29232 Regency Cir
- 29264 Regency Cir
- 29265 Regency Cir
- 29266 Grande Ct
- 29221 Regency Cir
- 29228 Regency Cir
- 29275 Grande Ct
- 29268 Regency Cir
- 29118 Weybridge Dr