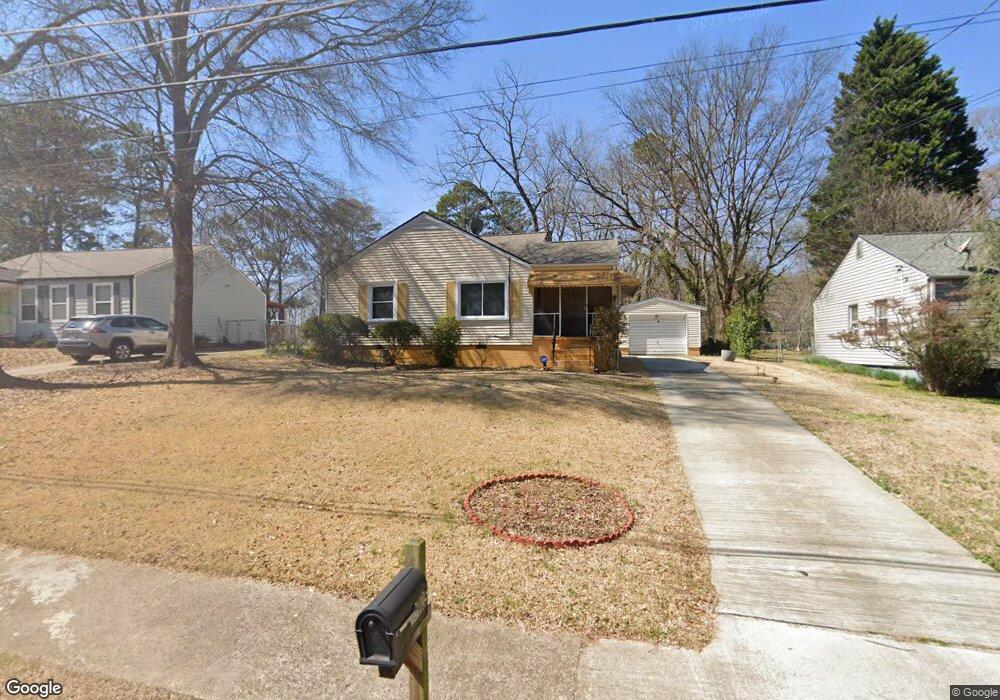
2925 Blount St Unit 3 Atlanta, GA 30344
Estimated Value: $216,538 - $288,000
3
Beds
2
Baths
1,402
Sq Ft
$183/Sq Ft
Est. Value
About This Home
This home is located at 2925 Blount St Unit 3, Atlanta, GA 30344 and is currently estimated at $255,885, approximately $182 per square foot. 2925 Blount St Unit 3 is a home located in Fulton County with nearby schools including Parklane Elementary School, Paul D. West Middle School, and Tri-Cities High School.
Ownership History
Date
Name
Owned For
Owner Type
Purchase Details
Closed on
Dec 21, 1999
Sold by
Wertz Ernesine C
Bought by
Jenkins Juliana
Current Estimated Value
Home Financials for this Owner
Home Financials are based on the most recent Mortgage that was taken out on this home.
Original Mortgage
$66,500
Outstanding Balance
$24,274
Interest Rate
7.85%
Mortgage Type
New Conventional
Estimated Equity
$231,611
Purchase Details
Closed on
Jul 19, 1999
Sold by
Wertz Ernestine C
Bought by
Monfort Tommy L and Monfort Cora L
Home Financials for this Owner
Home Financials are based on the most recent Mortgage that was taken out on this home.
Original Mortgage
$60,992
Interest Rate
7.51%
Mortgage Type
FHA
Purchase Details
Closed on
Mar 6, 1996
Sold by
Sheets Carl M
Bought by
Cbh Group The
Create a Home Valuation Report for This Property
The Home Valuation Report is an in-depth analysis detailing your home's value as well as a comparison with similar homes in the area
Home Values in the Area
Average Home Value in this Area
Purchase History
| Date | Buyer | Sale Price | Title Company |
|---|---|---|---|
| Jenkins Juliana | $70,000 | -- | |
| Monfort Tommy L | $61,500 | -- | |
| Cbh Group The | $21,500 | -- |
Source: Public Records
Mortgage History
| Date | Status | Borrower | Loan Amount |
|---|---|---|---|
| Open | Jenkins Juliana | $66,500 | |
| Previous Owner | Monfort Tommy L | $60,992 |
Source: Public Records
Tax History Compared to Growth
Tax History
| Year | Tax Paid | Tax Assessment Tax Assessment Total Assessment is a certain percentage of the fair market value that is determined by local assessors to be the total taxable value of land and additions on the property. | Land | Improvement |
|---|---|---|---|---|
| 2025 | $60 | $85,560 | $23,160 | $62,400 |
| 2023 | $3,011 | $106,680 | $47,640 | $59,040 |
| 2022 | $8 | $79,560 | $17,360 | $62,200 |
| 2021 | $68 | $77,280 | $16,880 | $60,400 |
| 2020 | $69 | $58,960 | $10,720 | $48,240 |
| 2019 | $60 | $31,000 | $5,240 | $25,760 |
| 2018 | $2 | $17,560 | $1,960 | $15,600 |
| 2017 | $60 | $9,560 | $1,840 | $7,720 |
| 2016 | $174 | $9,560 | $1,840 | $7,720 |
| 2015 | $174 | $9,560 | $1,840 | $7,720 |
| 2014 | $320 | $9,560 | $1,840 | $7,720 |
Source: Public Records
Map
Nearby Homes