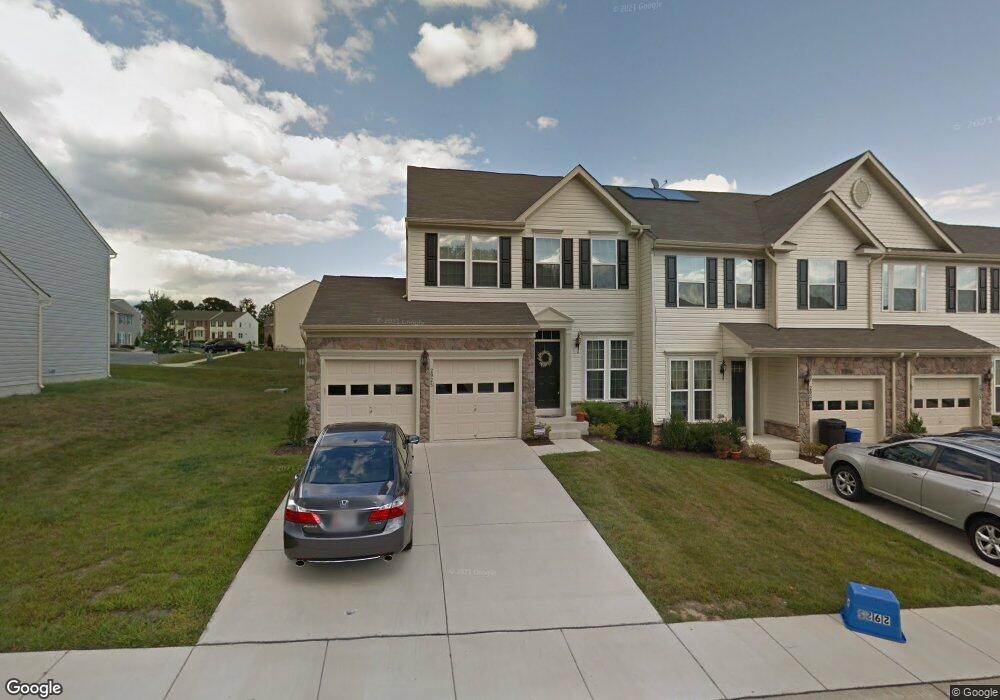
2925 Lomond Place Abingdon, MD 21009
Estimated Value: $400,119 - $443,000
Studio
1
Bath
1,872
Sq Ft
$227/Sq Ft
Est. Value
About This Home
This home is located at 2925 Lomond Place, Abingdon, MD 21009 and is currently estimated at $424,780, approximately $226 per square foot. 2925 Lomond Place is a home located in Harford County with nearby schools including Emmorton Elementary School, Bel Air Middle School, and Bel Air High School.
Ownership History
Date
Name
Owned For
Owner Type
Purchase Details
Closed on
May 25, 2018
Sold by
Lundy John Ryan
Bought by
Vanhoy Randall Allen and Gray Jennifer
Current Estimated Value
Home Financials for this Owner
Home Financials are based on the most recent Mortgage that was taken out on this home.
Original Mortgage
$255,920
Outstanding Balance
$220,861
Interest Rate
4.5%
Mortgage Type
New Conventional
Estimated Equity
$203,919
Purchase Details
Closed on
Aug 9, 2011
Sold by
Nvr Inc
Bought by
Lundy John Ryan
Home Financials for this Owner
Home Financials are based on the most recent Mortgage that was taken out on this home.
Original Mortgage
$253,288
Interest Rate
4.51%
Mortgage Type
New Conventional
Purchase Details
Closed on
Jul 29, 2011
Sold by
Undisclsoed
Bought by
Nvr Inc
Home Financials for this Owner
Home Financials are based on the most recent Mortgage that was taken out on this home.
Original Mortgage
$253,288
Interest Rate
4.51%
Mortgage Type
New Conventional
Create a Home Valuation Report for This Property
The Home Valuation Report is an in-depth analysis detailing your home's value as well as a comparison with similar homes in the area
Home Values in the Area
Average Home Value in this Area
Purchase History
| Date | Buyer | Sale Price | Title Company |
|---|---|---|---|
| Vanhoy Randall Allen | $319,900 | Universal Title | |
| Lundy John Ryan | $316,610 | -- | |
| Lundy John Ryan | $316,610 | -- | |
| Nvr Inc | -- | -- |
Source: Public Records
Mortgage History
| Date | Status | Borrower | Loan Amount |
|---|---|---|---|
| Open | Vanhoy Randall Allen | $255,920 | |
| Closed | Vanhoy Randall Allen | $63,980 | |
| Previous Owner | Lundy John Ryan | $253,288 | |
| Closed | Lundy John Ryan | $0 |
Source: Public Records
Tax History
| Year | Tax Paid | Tax Assessment Tax Assessment Total Assessment is a certain percentage of the fair market value that is determined by local assessors to be the total taxable value of land and additions on the property. | Land | Improvement |
|---|---|---|---|---|
| 2025 | $3,409 | $354,433 | $0 | $0 |
| 2024 | $3,409 | $325,467 | $0 | $0 |
| 2023 | $3,232 | $296,500 | $85,000 | $211,500 |
| 2022 | $3,201 | $293,733 | $0 | $0 |
| 2021 | $9,777 | $290,967 | $0 | $0 |
| 2020 | $3,326 | $288,200 | $85,000 | $203,200 |
| 2019 | $0 | $286,167 | $0 | $0 |
| 2018 | $3,279 | $284,133 | $0 | $0 |
| 2017 | $3,226 | $282,100 | $0 | $0 |
| 2016 | $140 | $282,100 | $0 | $0 |
| 2015 | -- | $282,100 | $0 | $0 |
| 2014 | -- | $285,800 | $0 | $0 |
Source: Public Records
Map
Nearby Homes
- 2909 Islay Ct
- 2911 Islay Ct
- 301 Lothian Way Unit 104
- 1909 Glenroths Dr
- 566 Kirkcaldy Way
- 2300 Arthurs Woods Dr
- 460 Deer Hill Cir
- 455 Deer Hill Cir
- 400 Teresa Marie Ct
- 725 Shallow Ridge Ct
- 723 Shallow Ridge Ct
- 0 W Wheel Rd Unit MDHR2045912
- 2815 Lanarkshire Way
- 504 Winter Span Ct
- 419 Clydebank Dr
- 2310 Bell's Tower Ct
- 425 Foreland Garth
- 2204 Autumn Glow Ct
- 352 Foreland Garth
- 202 Burkwood Ct
- 2925 Lomond Place Unit 109
- 2927 Lomond Place Unit 108
- 2927 Lomond Place
- 2929 Lomond Place Unit 107
- 2931 Lomond Place Unit 106
- 2923 Lomond Place
- 2921 Lomond Place
- 2917 Lomond Place
- 2918 Lomond Place
- 2918 Lomond Place Unit 83
- 2912 Lomond Place
- 2924 Lomond Place
- 2928 Lomond Place Unit 88
- 2915 Lomond Place
- 731 Perthshire Place
- 638 Tantallon Ct
- 2913 Lomond Place
- 2937 Lomond Place
- 636 Tantallon Ct
- 2932 Lomond Place
Your Personal Tour Guide
Ask me questions while you tour the home.