2925 N Twyman Rd Independence, MO 64058
Estimated Value: $230,678 - $388,000
2
Beds
1
Bath
1,640
Sq Ft
$182/Sq Ft
Est. Value
About This Home
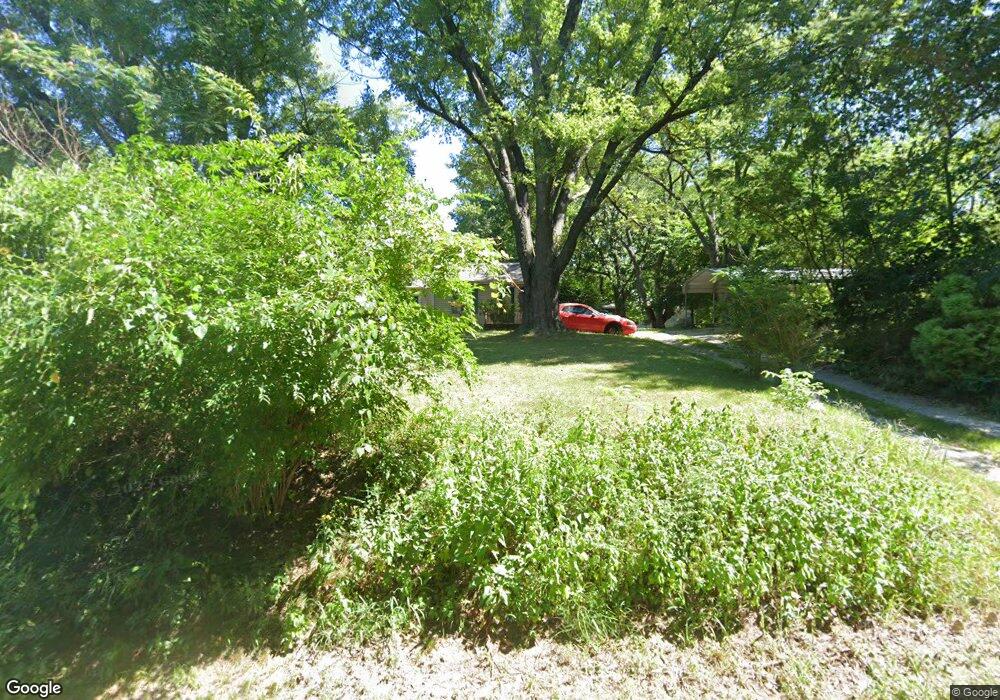
This home is located at 2925 N Twyman Rd, Independence, MO 64058 and is currently estimated at $297,920, approximately $181 per square foot. 2925 N Twyman Rd is a home located in Jackson County with nearby schools including Fort Osage High School.
Ownership History
Date
Name
Owned For
Owner Type
Purchase Details
Closed on
Nov 12, 2019
Sold by
Sturgis Janey M
Bought by
Buchanan William Alec
Current Estimated Value
Home Financials for this Owner
Home Financials are based on the most recent Mortgage that was taken out on this home.
Original Mortgage
$100,000
Outstanding Balance
$67,438
Interest Rate
3.65%
Mortgage Type
New Conventional
Estimated Equity
$230,482
Purchase Details
Closed on
May 28, 2015
Sold by
Pritchett Janey M
Bought by
Sturgis Janey M
Purchase Details
Closed on
Mar 2, 2012
Sold by
Pritchett Janey M and Pritchett David W
Bought by
Pritchett Janey M
Purchase Details
Closed on
Feb 4, 2010
Sold by
Sturgis Janey M
Bought by
Pritchett Janey M and Pritchett David W
Purchase Details
Closed on
May 26, 2005
Sold by
Brainard Glenn H and Brainard Rhea Sue
Bought by
Sturgis Janey M
Home Financials for this Owner
Home Financials are based on the most recent Mortgage that was taken out on this home.
Original Mortgage
$98,455
Interest Rate
5.83%
Mortgage Type
FHA
Create a Home Valuation Report for This Property
The Home Valuation Report is an in-depth analysis detailing your home's value as well as a comparison with similar homes in the area
Purchase History
| Date | Buyer | Sale Price | Title Company |
|---|---|---|---|
| Buchanan William Alec | -- | First American Title Ins Co | |
| Sturgis Janey M | -- | None Available | |
| Pritchett Janey M | -- | None Available | |
| Pritchett Janey M | -- | None Available | |
| Sturgis Janey M | -- | First American Title Ins Co |
Source: Public Records
Mortgage History
| Date | Status | Borrower | Loan Amount |
|---|---|---|---|
| Open | Buchanan William Alec | $100,000 | |
| Previous Owner | Sturgis Janey M | $98,455 |
Source: Public Records
Tax History
| Year | Tax Paid | Tax Assessment Tax Assessment Total Assessment is a certain percentage of the fair market value that is determined by local assessors to be the total taxable value of land and additions on the property. | Land | Improvement |
|---|---|---|---|---|
| 2025 | $2,940 | $29,399 | $3,561 | $25,838 |
| 2024 | $2,914 | $32,872 | $5,322 | $27,550 |
| 2023 | $2,914 | $32,872 | $4,511 | $28,361 |
| 2022 | $2,080 | $22,230 | $3,981 | $18,249 |
| 2021 | $2,082 | $22,230 | $3,981 | $18,249 |
| 2020 | $1,848 | $19,445 | $3,981 | $15,464 |
| 2019 | $1,811 | $19,445 | $3,981 | $15,464 |
| 2018 | $1,583 | $16,924 | $3,465 | $13,459 |
| 2017 | $1,583 | $16,924 | $3,465 | $13,459 |
| 2016 | $1,424 | $16,500 | $1,255 | $15,245 |
Source: Public Records
Map
Nearby Homes
- 2807 N Twyman Rd
- 2906 N Twyman Rd
- 2801 N Lentz Rd
- 3004 N Miller Dr
- 0 E Blue Mills Rd Unit 1992136
- 20300 Highway 24
- 3724 N Perrin Rd
- 26103 E Blue Mills Rd
- 20612 Highway 24
- 4703 N Hifner St
- 26612 E Blue Mills Rd
- 3901 N Koger Rd
- 22400 Frontage Rd
- 20242 E 17th Street Ct N
- 20401 E Bundschu Rd
- 2614 N Hoover Rd
- 1317 N Holland Ct
- 1325 N Holland Ct
- 1345 N Holland Ct
- 1621 N Belvidere Ave
- 2917 N Twyman Rd
- 2911 N Twyman Rd
- 2912 N Twyman Rd
- 3010 N Twyman Rd
- 2901 N Twyman Rd
- 3015 N Twyman Rd
- 2900 N Twyman Rd
- 2821 N Twyman Rd
- 2815 N Twyman Rd
- 2812 N Twyman Rd
- 2809 N Twyman Rd
- 2808 N Twyman Rd
- 2804 N Twyman Rd
- 2805 N Twyman Rd
- 2800 N Twyman Rd
- 2725 N Twyman Rd
- 3202 N Twyman Rd
- 2720 N Twyman Rd
- 2719 N Twyman Rd
- 23602 E Blue Mills Rd
Your Personal Tour Guide
Ask me questions while you tour the home.