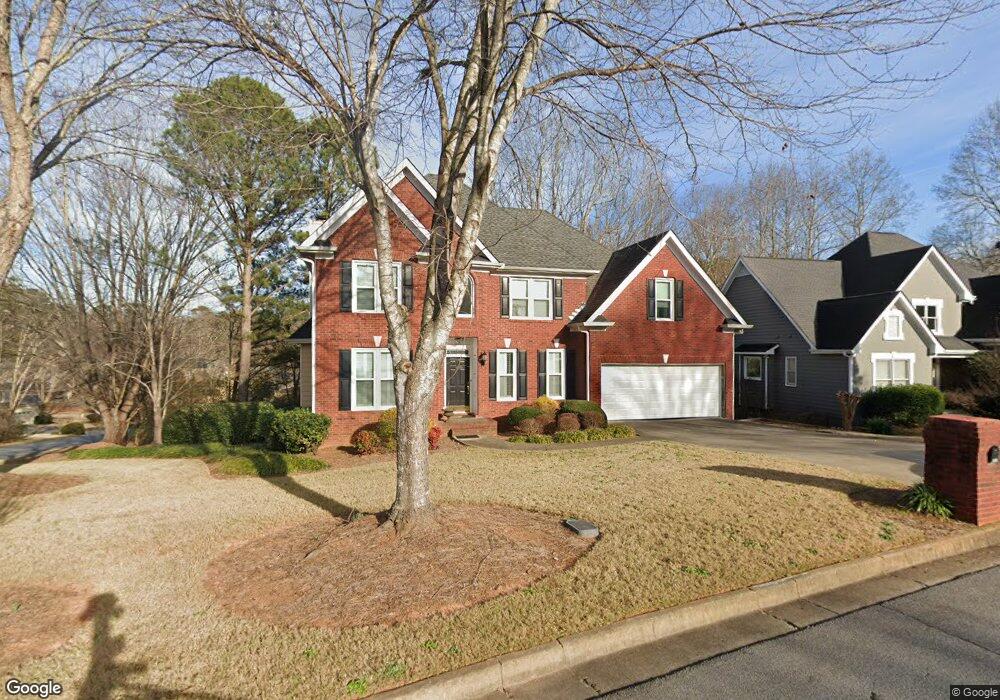
2925 Pine St Duluth, GA 30096
Estimated Value: $474,000 - $608,000
5
Beds
3
Baths
3,687
Sq Ft
$144/Sq Ft
Est. Value
About This Home
This home is located at 2925 Pine St, Duluth, GA 30096 and is currently estimated at $531,991, approximately $144 per square foot. 2925 Pine St is a home located in Gwinnett County with nearby schools including Chattahoochee Elementary School, Coleman Middle School, and Duluth High School.
Ownership History
Date
Name
Owned For
Owner Type
Purchase Details
Closed on
Feb 28, 2025
Sold by
Tran Real Estate Investment Llc
Bought by
Vancao Vincent Van and Vancao Vincent
Current Estimated Value
Home Financials for this Owner
Home Financials are based on the most recent Mortgage that was taken out on this home.
Original Mortgage
$382,000
Outstanding Balance
$371,411
Interest Rate
6.12%
Mortgage Type
New Conventional
Estimated Equity
$160,580
Purchase Details
Closed on
Dec 21, 2022
Sold by
Southern State Investments Llc
Bought by
Tran Real Estate Investment Llc
Purchase Details
Closed on
Nov 18, 1994
Sold by
Willis John Homes Inc
Bought by
Norman Lane H Cheryl A
Home Financials for this Owner
Home Financials are based on the most recent Mortgage that was taken out on this home.
Original Mortgage
$177,400
Interest Rate
7.5%
Create a Home Valuation Report for This Property
The Home Valuation Report is an in-depth analysis detailing your home's value as well as a comparison with similar homes in the area
Home Values in the Area
Average Home Value in this Area
Purchase History
| Date | Buyer | Sale Price | Title Company |
|---|---|---|---|
| Vancao Vincent Van | $510,000 | -- | |
| Tran Real Estate Investment Llc | $350,000 | -- | |
| Norman Lane H Cheryl A | $186,800 | -- |
Source: Public Records
Mortgage History
| Date | Status | Borrower | Loan Amount |
|---|---|---|---|
| Open | Vancao Vincent Van | $382,000 | |
| Previous Owner | Norman Lane H Cheryl A | $177,400 |
Source: Public Records
Tax History
| Year | Tax Paid | Tax Assessment Tax Assessment Total Assessment is a certain percentage of the fair market value that is determined by local assessors to be the total taxable value of land and additions on the property. | Land | Improvement |
|---|---|---|---|---|
| 2025 | $1,668 | $240,840 | $34,000 | $206,840 |
| 2024 | $6,540 | $204,360 | $32,000 | $172,360 |
| 2023 | $6,540 | $140,000 | $32,000 | $108,000 |
| 2022 | $4,303 | $173,560 | $32,000 | $141,560 |
| 2021 | $3,801 | $144,480 | $24,000 | $120,480 |
| 2020 | $3,837 | $144,480 | $24,000 | $120,480 |
| 2019 | $4,304 | $125,920 | $20,000 | $105,920 |
| 2018 | $3,448 | $125,920 | $20,000 | $105,920 |
| 2016 | $3,195 | $114,080 | $20,000 | $94,080 |
| 2015 | $3,765 | $107,960 | $16,000 | $91,960 |
| 2014 | $3,111 | $107,960 | $16,000 | $91,960 |
Source: Public Records
Map
Nearby Homes
- 2915 Pine St
- 2825 Pine St
- 2988 First St
- 2940 Towne Village Dr
- 2956 Chene Place
- 4193 Halton Rd
- 2870 Towne Village Dr NW
- 2870 Towne Village Dr
- 2711 Old Coach Rd
- 4053 Towne Creek Cove
- 2448 Chene Dr
- 3081 Frankie Ln
- 4125 Boles Creek Dr
- 3106 Moor View Rd
- 4109 Abbotts Bridge Rd
- 3875 Stonebriar Ct
- 3592 North St
- 3590 North St
- 3205 Ivy Station Dr
- 2643 Timberbrooke Place
- 2905 Pine St
- 2945 Pine St
- 2648 Baxter Pines Way
- 2658 Baxter Pines Way
- 2638 Baxter Pines Way
- 2668 Baxter Pines Way
- 2920 Pine St
- 2940 Pine St
- 2895 Pine St
- 2955 Pine St
- 2900 Pine St Unit 56
- 2900 Pine St
- 2950 Pine St
- 3820 Bridlewood Dr
- 2890 Pine St
- 2875 Pine St
- 3959 Keeneland Ct
- 3845 Bridlewood Dr
- 2960 Pine St
- 2880 Pine St Unit 54
Your Personal Tour Guide
Ask me questions while you tour the home.