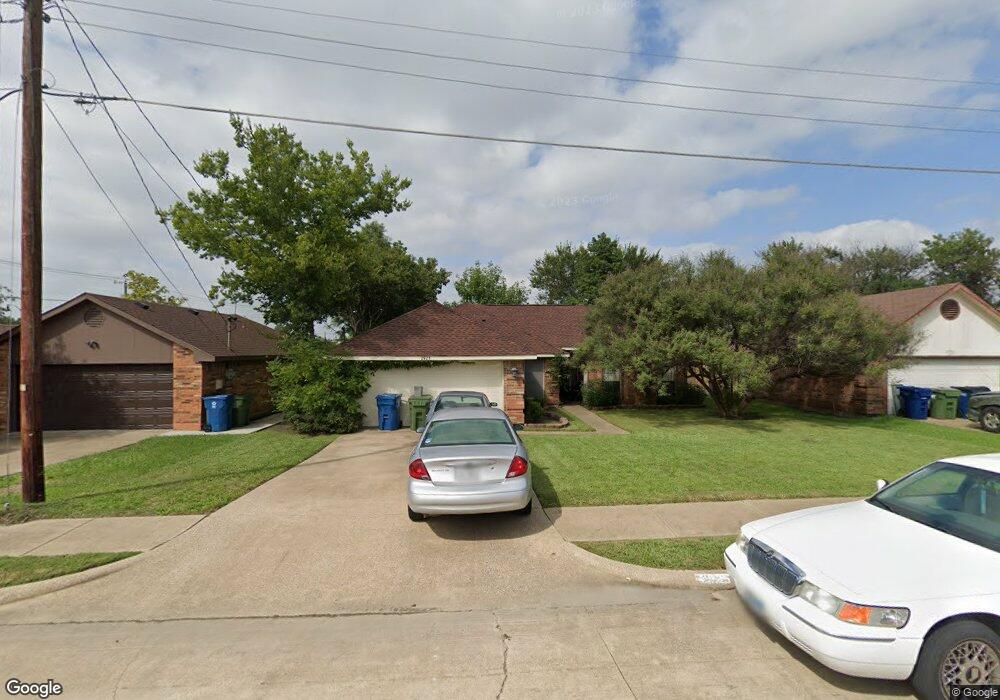
2925 Tina St Sachse, TX 75048
Estimated Value: $281,697 - $309,000
3
Beds
2
Baths
1,267
Sq Ft
$238/Sq Ft
Est. Value
About This Home
This home is located at 2925 Tina St, Sachse, TX 75048 and is currently estimated at $301,674, approximately $238 per square foot. 2925 Tina St is a home located in Dallas County with nearby schools including Firewheel Christian Academy and Pinnacle Montessori of Sachse.
Ownership History
Date
Name
Owned For
Owner Type
Purchase Details
Closed on
Nov 27, 2002
Sold by
Tina Trust #2925 and Lange Jackie
Bought by
Prater Sheila
Current Estimated Value
Home Financials for this Owner
Home Financials are based on the most recent Mortgage that was taken out on this home.
Original Mortgage
$103,680
Outstanding Balance
$44,183
Interest Rate
6.13%
Mortgage Type
FHA
Estimated Equity
$257,491
Purchase Details
Closed on
Nov 25, 1997
Sold by
Traditional Homes Inc
Bought by
West Angelika
Home Financials for this Owner
Home Financials are based on the most recent Mortgage that was taken out on this home.
Original Mortgage
$75,461
Interest Rate
7.3%
Purchase Details
Closed on
Aug 1, 1997
Sold by
Rogers Garry A and Rogers Cheryl L
Bought by
Traditional Homes Inc
Home Financials for this Owner
Home Financials are based on the most recent Mortgage that was taken out on this home.
Original Mortgage
$64,557
Interest Rate
7.59%
Create a Home Valuation Report for This Property
The Home Valuation Report is an in-depth analysis detailing your home's value as well as a comparison with similar homes in the area
Home Values in the Area
Average Home Value in this Area
Purchase History
| Date | Buyer | Sale Price | Title Company |
|---|---|---|---|
| Prater Sheila | -- | -- | |
| West Angelika | -- | -- | |
| Traditional Homes Inc | -- | -- |
Source: Public Records
Mortgage History
| Date | Status | Borrower | Loan Amount |
|---|---|---|---|
| Open | Prater Sheila | $103,680 | |
| Previous Owner | West Angelika | $75,461 | |
| Previous Owner | Traditional Homes Inc | $64,557 |
Source: Public Records
Tax History Compared to Growth
Tax History
| Year | Tax Paid | Tax Assessment Tax Assessment Total Assessment is a certain percentage of the fair market value that is determined by local assessors to be the total taxable value of land and additions on the property. | Land | Improvement |
|---|---|---|---|---|
| 2025 | $654 | $244,050 | $65,000 | $179,050 |
| 2024 | $654 | $254,680 | $65,000 | $189,680 |
| 2023 | $654 | $254,680 | $65,000 | $189,680 |
| 2022 | $5,156 | $215,510 | $65,000 | $150,510 |
| 2021 | $4,497 | $174,760 | $40,000 | $134,760 |
| 2020 | $4,572 | $174,760 | $40,000 | $134,760 |
| 2019 | $4,957 | $174,760 | $40,000 | $134,760 |
| 2018 | $4,303 | $150,260 | $40,000 | $110,260 |
| 2017 | $3,559 | $123,920 | $30,000 | $93,920 |
| 2016 | $3,171 | $110,420 | $20,000 | $90,420 |
| 2015 | $1,954 | $110,420 | $20,000 | $90,420 |
| 2014 | $1,954 | $83,830 | $20,000 | $63,830 |
Source: Public Records
Map
Nearby Homes
- 6315 Sachse St
- 2605 Mcdearmon St
- 6218 Dewitt St
- 3117 Tina St
- 2321 3rd St
- 5937 Boone St
- 6925 Dewitt Rd
- 5824 Boone St
- 2415 Green Meadow Dr
- 3206 Creekside Dr
- 2004 Bonanza Dr
- 3408 Lillie St
- 2011 Cori Place
- 2006 Cori Place
- 3324 Salmon St
- 3320 Salmon St
- 6905 Wilhelmina Dr
- 2209 Vicksburg Dr
- 3711 7th St
- 3818 Missouri St