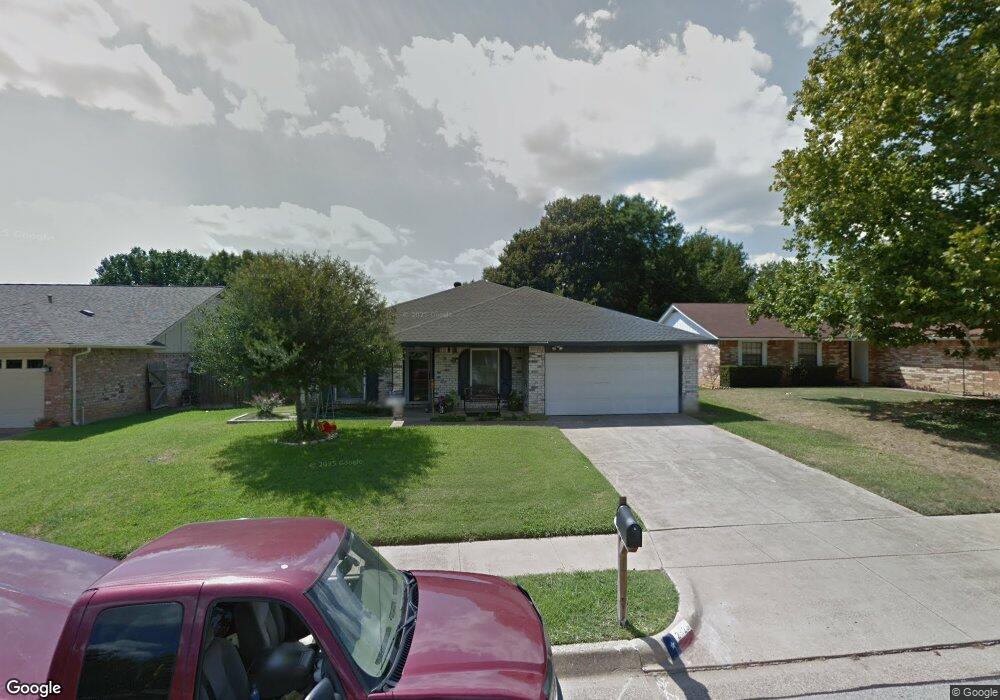
2925 Turtlerock Dr Bedford, TX 76021
Estimated Value: $375,228 - $397,000
3
Beds
2
Baths
1,810
Sq Ft
$213/Sq Ft
Est. Value
About This Home
This home is located at 2925 Turtlerock Dr, Bedford, TX 76021 and is currently estimated at $385,807, approximately $213 per square foot. 2925 Turtlerock Dr is a home located in Tarrant County with nearby schools including Spring Garden Elementary School, Harwood Junior High School, and Trinity High School.
Ownership History
Date
Name
Owned For
Owner Type
Purchase Details
Closed on
Mar 15, 2007
Sold by
Norgaard Jacob Michael and Luttrell Holly
Bought by
Beach Jeff and Beach Lisa
Current Estimated Value
Home Financials for this Owner
Home Financials are based on the most recent Mortgage that was taken out on this home.
Original Mortgage
$147,000
Outstanding Balance
$89,269
Interest Rate
6.32%
Mortgage Type
Purchase Money Mortgage
Estimated Equity
$296,538
Purchase Details
Closed on
Oct 28, 1996
Sold by
Amparan Ruben and Amparan Rosie J
Bought by
Norgaard Jacob Michael and Luttrell Holly
Home Financials for this Owner
Home Financials are based on the most recent Mortgage that was taken out on this home.
Original Mortgage
$89,100
Interest Rate
8.15%
Create a Home Valuation Report for This Property
The Home Valuation Report is an in-depth analysis detailing your home's value as well as a comparison with similar homes in the area
Home Values in the Area
Average Home Value in this Area
Purchase History
| Date | Buyer | Sale Price | Title Company |
|---|---|---|---|
| Beach Jeff | -- | Sierra Title | |
| Norgaard Jacob Michael | -- | First American Title Co |
Source: Public Records
Mortgage History
| Date | Status | Borrower | Loan Amount |
|---|---|---|---|
| Open | Beach Jeff | $147,000 | |
| Previous Owner | Norgaard Jacob Michael | $89,100 |
Source: Public Records
Tax History Compared to Growth
Tax History
| Year | Tax Paid | Tax Assessment Tax Assessment Total Assessment is a certain percentage of the fair market value that is determined by local assessors to be the total taxable value of land and additions on the property. | Land | Improvement |
|---|---|---|---|---|
| 2025 | $5,076 | $371,316 | $75,000 | $296,316 |
| 2024 | $5,076 | $371,316 | $75,000 | $296,316 |
| 2023 | $5,678 | $368,711 | $45,000 | $323,711 |
| 2022 | $5,878 | $305,989 | $45,000 | $260,989 |
| 2021 | $5,763 | $273,137 | $45,000 | $228,137 |
| 2020 | $5,288 | $252,027 | $45,000 | $207,027 |
| 2019 | $4,912 | $253,794 | $45,000 | $208,794 |
| 2018 | $4,084 | $183,811 | $45,000 | $138,811 |
| 2017 | $4,042 | $201,600 | $18,000 | $183,600 |
| 2016 | $3,675 | $201,537 | $18,000 | $183,537 |
| 2015 | $3,468 | $138,100 | $18,000 | $120,100 |
| 2014 | $3,468 | $138,100 | $18,000 | $120,100 |
Source: Public Records
Map
Nearby Homes
- 2922 Beachtree Ln
- 2909 Oakridge Dr
- 2600 Willow Bend
- 3024 Highgate Ln
- 2616 Greenwood Ct
- 2220 Tiffany Glenn Ct
- 2521 Sanders Ct
- 3152 Woodbridge Dr
- 2709 Willow Bend
- 2516 Classic Ct W
- 2601 Murphy Dr
- 2609 Woodson Dr
- 2700 Mimosa Ct
- 2417 Meadow Ct
- 2501 Murphy Dr
- 3017 Bluebonnet Ln
- 3532 Meadowside Dr
- 3513 Meadowside Dr
- 2209 Laurel Ct
- 3721 Fieldcrest Ln
- 2929 Turtlerock Dr
- 2921 Turtlerock Dr
- 2933 Turtlerock Dr
- 2924 Woodbridge Dr
- 2920 Woodbridge Dr
- 2928 Woodbridge Dr
- 2916 Woodbridge Dr
- 2928 Turtlerock Dr
- 2924 Turtlerock Dr
- 2917 Turtlerock Dr
- 2932 Woodbridge Dr
- 2920 Turtlerock Dr
- 2937 Turtlerock Dr
- 2912 Woodbridge Dr
- 2936 Woodbridge Dr
- 2916 Turtlerock Dr
- 2913 Turtlerock Dr
- 2932 Turtlerock Dr
- 2941 Turtlerock Dr
- 2908 Woodbridge Dr