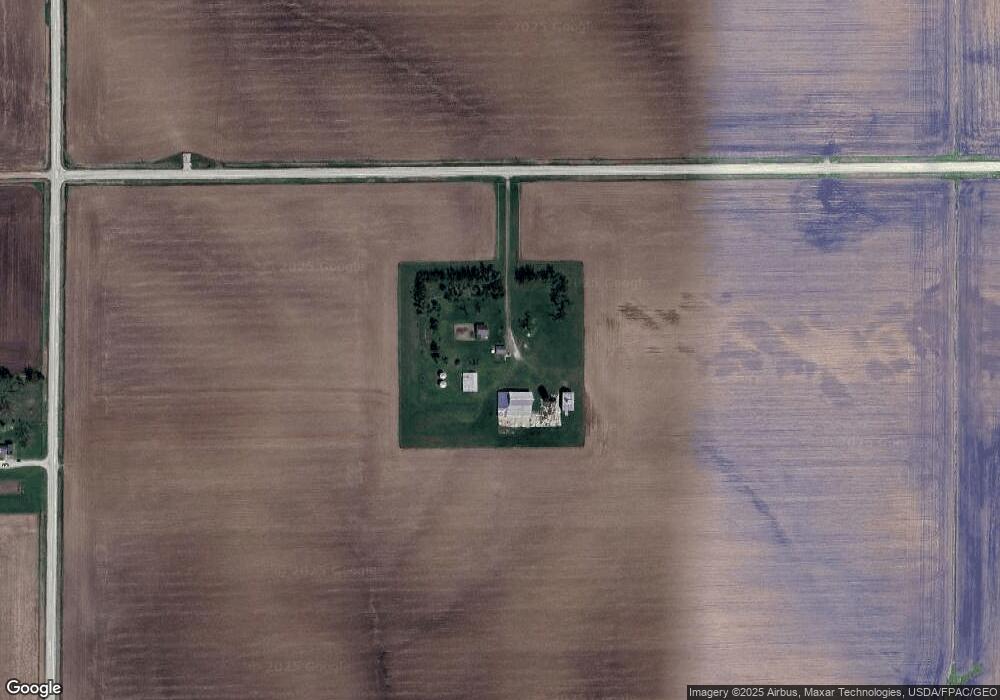
2926 66th St Shellsburg, IA 52332
Estimated Value: $293,000 - $388,286
About This Home
This home is located at 2926 66th St, Shellsburg, IA 52332 and is currently estimated at $341,322, approximately $272 per square foot. 2926 66th St is a home located in Benton County with nearby schools including Shellsburg Elementary School, Vinton-Shellsburg Middle School, and Vinton-Shellsburg High School.
Ownership History
We collect this data history from publicly available records. To have your information removed, we recommend requesting removal directly through your county’s website.
Purchase Details
Home Financials for this Owner
Home Financials are based on the most recent Mortgage that was taken out on this home.Purchase History
We collect this data history from publicly available records. To have your information removed, we recommend requesting removal directly through your county’s website.
| Date | Buyer | Sale Price | Title Company |
|---|---|---|---|
| $163,000 | None Available |
Mortgage History
We collect this data history from publicly available records. To have your information removed, we recommend requesting removal directly through your county’s website.
| Date | Status | Borrower | Loan Amount |
|---|---|---|---|
| Open | $60,700 |
Tax History
We collect this data history from publicly available records. To have your information removed, we recommend requesting removal directly through your county’s website.
| Year | Tax Paid | Tax Assessment Tax Assessment Total Assessment is a certain percentage of the fair market value that is determined by local assessors to be the total taxable value of land and additions on the property. | Land | Improvement |
|---|---|---|---|---|
| 2025 | $3,516 | $296,700 | $126,300 | $170,400 |
| 2024 | $3,516 | $274,100 | $119,400 | $154,700 |
| 2023 | $3,210 | $274,100 | $119,400 | $154,700 |
| 2022 | $3,174 | $217,200 | $95,500 | $121,700 |
| 2021 | $3,174 | $217,200 | $95,500 | $121,700 |
| 2020 | $3,172 | $213,400 | $61,800 | $151,600 |
| 2019 | $2,908 | $227,500 | $61,800 | $165,700 |
| 2018 | $2,824 | $206,200 | $53,500 | $152,700 |
| 2017 | $2,682 | $206,200 | $53,500 | $152,700 |
| 2016 | $2,608 | $190,000 | $48,600 | $141,400 |
| 2015 | $2,608 | $190,000 | $48,600 | $141,400 |
| 2014 | $2,278 | $167,200 | $0 | $0 |
Map
- 0 67th St
- 67th St
- 6752 29th Ave
- 6453 31st Ave
- 6676 32nd Ave
- 804 Fairway Dr
- 92 Wildcat Trail SW
- 105 Meadow Dr
- 103 Meadow Dr
- 700 Sunset Blvd
- 101 Meadow Dr
- 401 Main St NW
- 711 Main St NE
- 0 31st Ave
- 6719 25th Ave
- 0 Linn Benton Rd Unit 202604097
- 0 Linn Benton Rd Unit 2604634
- 0 61st St Ln Unit 2605158
- 215 Main St
- 505 5th St E
Ask me questions while you tour the home.