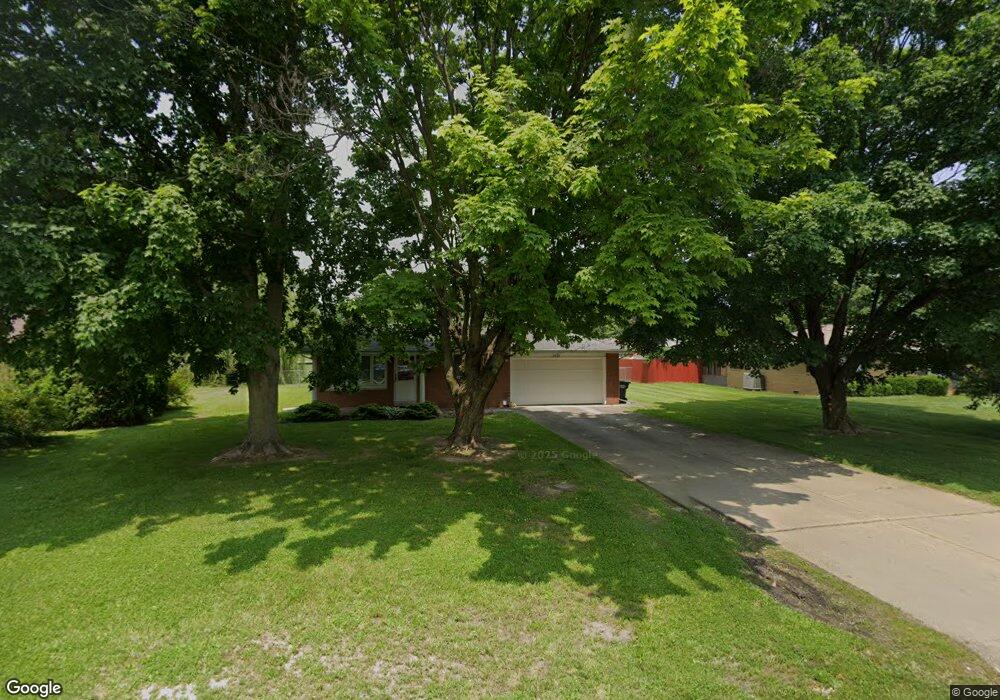
2926 E 8th St Anderson, IN 46012
Estimated Value: $175,000 - $208,000
3
Beds
2
Baths
1,517
Sq Ft
$125/Sq Ft
Est. Value
About This Home
This home is located at 2926 E 8th St, Anderson, IN 46012 and is currently estimated at $189,325, approximately $124 per square foot. 2926 E 8th St is a home located in Madison County with nearby schools including Tenth Street Elementary School, Highland Middle School, and Anderson High School.
Ownership History
Date
Name
Owned For
Owner Type
Purchase Details
Closed on
Jun 17, 2010
Sold by
Secretary Of Hud Of Washington Dc
Bought by
Sparks Jefferey M
Current Estimated Value
Purchase Details
Closed on
Dec 30, 2009
Sold by
Bac Home Loans Servicing L P
Bought by
Secretary Of Hud
Purchase Details
Closed on
Oct 9, 2009
Sold by
Ancil George A and Ancil Amanda K
Bought by
Bac Home Loans Servicing L P
Create a Home Valuation Report for This Property
The Home Valuation Report is an in-depth analysis detailing your home's value as well as a comparison with similar homes in the area
Home Values in the Area
Average Home Value in this Area
Purchase History
| Date | Buyer | Sale Price | Title Company |
|---|---|---|---|
| Sparks Jefferey M | -- | -- | |
| Secretary Of Hud | -- | -- | |
| Bac Home Loans Servicing L P | $143,685 | -- |
Source: Public Records
Tax History Compared to Growth
Tax History
| Year | Tax Paid | Tax Assessment Tax Assessment Total Assessment is a certain percentage of the fair market value that is determined by local assessors to be the total taxable value of land and additions on the property. | Land | Improvement |
|---|---|---|---|---|
| 2025 | $710 | $104,900 | $14,100 | $90,800 |
| 2024 | $710 | $104,900 | $14,100 | $90,800 |
| 2023 | $706 | $96,300 | $13,400 | $82,900 |
| 2022 | $762 | $96,600 | $12,900 | $83,700 |
| 2021 | $940 | $86,600 | $12,800 | $73,800 |
| 2020 | $896 | $82,600 | $12,100 | $70,500 |
| 2019 | $897 | $82,700 | $12,100 | $70,600 |
| 2018 | $831 | $76,200 | $12,100 | $64,100 |
| 2017 | $760 | $75,400 | $12,100 | $63,300 |
| 2016 | $760 | $75,400 | $12,100 | $63,300 |
| 2014 | $804 | $79,000 | $11,900 | $67,100 |
| 2013 | $804 | $79,100 | $11,900 | $67,200 |
Source: Public Records
Map
Nearby Homes
- 2701 E 8th St
- 0 Hanover Dr
- 0 S Rangeline Rd Unit MBR22058812
- 2526 E 5th St
- 2509 Fowler St
- 1521 Daleville Ave
- 2313 E 5th St
- 2405 E 3rd St
- 2315 E 3rd St
- 2208 E 5th St
- 916 Alhambra Dr
- 239 N Coventry Dr
- 1921 E 10th St
- 1803 E 10th St
- 701 Westgate Dr
- 1606 E 8th St
- 1919 S Scatterfield Rd
- 809 Deerfield Rd
- 1708 Falls Ct
- 1708 C St