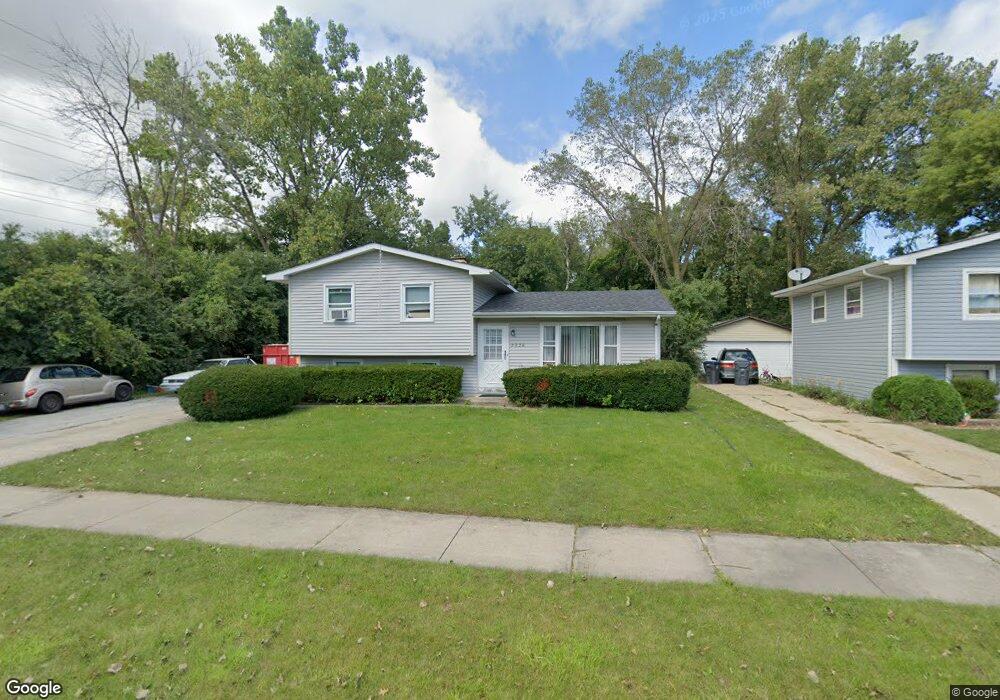
2926 Hyde Park Ave Waukegan, IL 60085
West Waukegan NeighborhoodEstimated Value: $267,000 - $273,000
3
Beds
2
Baths
981
Sq Ft
$275/Sq Ft
Est. Value
About This Home
This home is located at 2926 Hyde Park Ave, Waukegan, IL 60085 and is currently estimated at $269,768, approximately $274 per square foot. 2926 Hyde Park Ave is a home located in Lake County with nearby schools including Whittier Elementary School, Robert E. Abbott Middle School, and Waukegan High School.
Ownership History
Date
Name
Owned For
Owner Type
Purchase Details
Closed on
Apr 25, 2001
Sold by
Ofilanda Manuel C and Ofilanda Lynn
Bought by
Mireles Juan M and Mireles Rosalba
Current Estimated Value
Home Financials for this Owner
Home Financials are based on the most recent Mortgage that was taken out on this home.
Original Mortgage
$145,614
Outstanding Balance
$54,372
Interest Rate
7.03%
Mortgage Type
FHA
Estimated Equity
$215,396
Purchase Details
Closed on
Jul 30, 1997
Sold by
Pott Cheryl E
Bought by
Ofilanda Manuel C and Ofilanda Lynn
Home Financials for this Owner
Home Financials are based on the most recent Mortgage that was taken out on this home.
Original Mortgage
$125,358
Interest Rate
7.71%
Mortgage Type
VA
Purchase Details
Closed on
Apr 25, 1994
Sold by
Schroeder Sandra S
Bought by
Pott Cheryl E
Home Financials for this Owner
Home Financials are based on the most recent Mortgage that was taken out on this home.
Original Mortgage
$103,450
Interest Rate
4.75%
Create a Home Valuation Report for This Property
The Home Valuation Report is an in-depth analysis detailing your home's value as well as a comparison with similar homes in the area
Home Values in the Area
Average Home Value in this Area
Purchase History
| Date | Buyer | Sale Price | Title Company |
|---|---|---|---|
| Mireles Juan M | $148,000 | -- | |
| Ofilanda Manuel C | $83,333 | -- | |
| Pott Cheryl E | -- | -- |
Source: Public Records
Mortgage History
| Date | Status | Borrower | Loan Amount |
|---|---|---|---|
| Open | Mireles Juan M | $145,614 | |
| Previous Owner | Ofilanda Manuel C | $125,358 | |
| Previous Owner | Pott Cheryl E | $103,450 |
Source: Public Records
Tax History Compared to Growth
Tax History
| Year | Tax Paid | Tax Assessment Tax Assessment Total Assessment is a certain percentage of the fair market value that is determined by local assessors to be the total taxable value of land and additions on the property. | Land | Improvement |
|---|---|---|---|---|
| 2024 | $4,747 | $65,164 | $12,416 | $52,748 |
| 2023 | $5,098 | $58,343 | $11,117 | $47,226 |
| 2022 | $5,098 | $58,143 | $10,241 | $47,902 |
| 2021 | $4,600 | $50,120 | $8,750 | $41,370 |
| 2020 | $4,613 | $46,693 | $8,152 | $38,541 |
| 2019 | $4,590 | $42,787 | $7,470 | $35,317 |
| 2018 | $4,524 | $41,374 | $11,535 | $29,839 |
| 2017 | $4,353 | $36,604 | $10,205 | $26,399 |
| 2016 | $3,988 | $31,808 | $8,868 | $22,940 |
| 2015 | $3,796 | $28,469 | $7,937 | $20,532 |
| 2014 | $3,287 | $24,966 | $8,500 | $16,466 |
| 2012 | $4,293 | $27,047 | $9,208 | $17,839 |
Source: Public Records
Map
Nearby Homes
- 621 N Austin Ave
- 34887 N Austin Ave
- 603 N Austin Ave
- 3170 W Monroe St Unit 309
- 102 Baldwin Ave
- 12698 W Grandview Ave
- 12716 W Grandview Ave
- 3210 W Grandview Ave
- 525 Lawrence Ave
- 0 Brookside Ave
- 24 Washington Terrace
- 3482 Ellis Ave
- 427 Tiffany Dr
- 615 Tiffany Dr
- 35400 N Green Bay Rd
- 2813 Theresa Ave
- 963 Belle Plaine Ave
- 1213 Grand Ave
- 1048 Belle Plaine Ave
- 2726 W Hidden Glen Dr
- 2924 Hyde Park Ave
- 2922 Hyde Park Ave
- 2929 Hyde Park Ave
- 2921 Ellis St
- 2927 Hyde Park Ave
- 2920 Hyde Park Ave
- 2925 Hyde Park Ave
- 2915 Ellis St
- 2926 Carriage Ln
- 2913 Ellis St
- 2913 Hyde Park Ave
- 2908 Hyde Park Ave
- 2918 Carriage Ln
- 2909 Ellis St
- 2909 Hyde Park Ave
- 2914 Carriage Ln
- 2920 Ellis St
- 2904 Hyde Park Ave
- 517 Public Service Ave
- 509 Public Service Ave