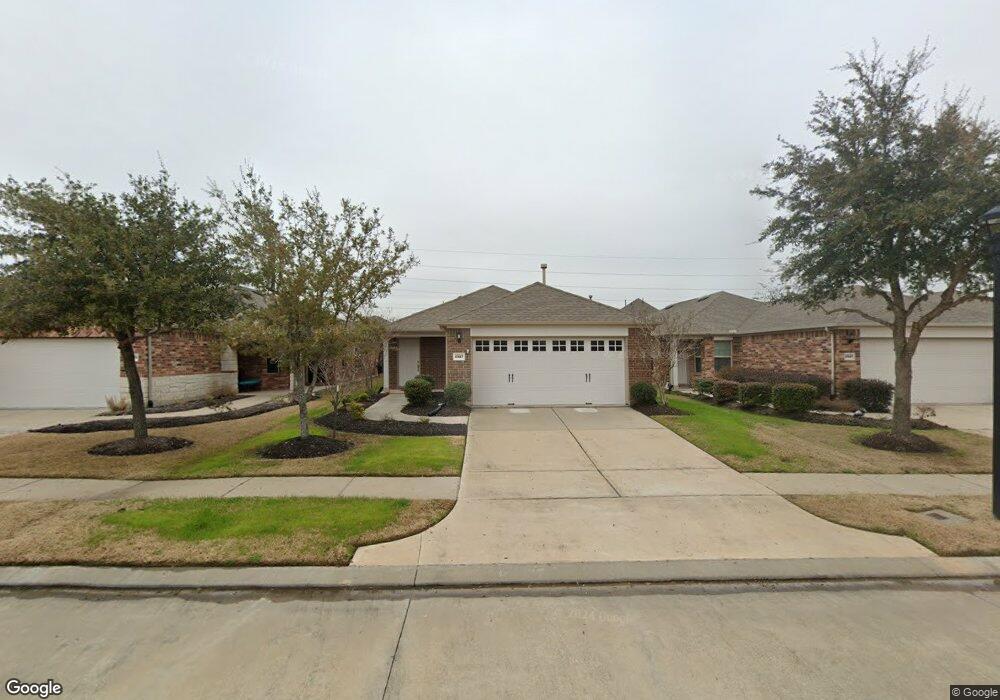
2927 Cone Flower Dr Richmond, TX 77469
Estimated Value: $255,467 - $298,000
2
Beds
2
Baths
1,149
Sq Ft
$238/Sq Ft
Est. Value
About This Home
This home is located at 2927 Cone Flower Dr, Richmond, TX 77469 and is currently estimated at $273,867, approximately $238 per square foot. 2927 Cone Flower Dr is a home located in Fort Bend County with nearby schools including J J Wessendorff Middle School, Lamar Junior High School, and Lamar Consolidated High School.
Ownership History
Date
Name
Owned For
Owner Type
Purchase Details
Closed on
Jan 10, 2024
Sold by
Sheridan James Michael
Bought by
Jim Sheridan Living Trust and Sheridan
Current Estimated Value
Purchase Details
Closed on
Aug 17, 2015
Sold by
Neumann Betty J
Bought by
Sheridan James M
Home Financials for this Owner
Home Financials are based on the most recent Mortgage that was taken out on this home.
Original Mortgage
$8,000
Interest Rate
4.08%
Mortgage Type
New Conventional
Purchase Details
Closed on
Nov 20, 2013
Sold by
Pulte Homes Of Texas L P
Bought by
Neumann Betty J
Home Financials for this Owner
Home Financials are based on the most recent Mortgage that was taken out on this home.
Original Mortgage
$145,474
Interest Rate
4.29%
Mortgage Type
New Conventional
Purchase Details
Closed on
Jan 19, 2012
Sold by
Cw Richmond Lp
Bought by
Sheridan James M
Create a Home Valuation Report for This Property
The Home Valuation Report is an in-depth analysis detailing your home's value as well as a comparison with similar homes in the area
Home Values in the Area
Average Home Value in this Area
Purchase History
| Date | Buyer | Sale Price | Title Company |
|---|---|---|---|
| Jim Sheridan Living Trust | -- | None Listed On Document | |
| Sheridan James M | -- | Startex Title Co | |
| Neumann Betty J | -- | None Available | |
| Sheridan James M | -- | -- | |
| Sheridan James M | -- | -- |
Source: Public Records
Mortgage History
| Date | Status | Borrower | Loan Amount |
|---|---|---|---|
| Previous Owner | Sheridan James M | $8,000 | |
| Previous Owner | Sheridan James M | $145,474 |
Source: Public Records
Tax History Compared to Growth
Tax History
| Year | Tax Paid | Tax Assessment Tax Assessment Total Assessment is a certain percentage of the fair market value that is determined by local assessors to be the total taxable value of land and additions on the property. | Land | Improvement |
|---|---|---|---|---|
| 2025 | $2,777 | $254,428 | $40,950 | $213,478 |
| 2024 | $2,777 | $238,370 | $25,787 | $212,583 |
| 2023 | $798 | $216,700 | $3,894 | $212,806 |
| 2022 | $4,097 | $197,000 | $9,080 | $187,920 |
| 2021 | $5,292 | $179,090 | $31,500 | $147,590 |
| 2020 | $5,343 | $175,920 | $31,500 | $144,420 |
| 2019 | $5,530 | $171,000 | $31,500 | $139,500 |
| 2018 | $5,551 | $169,810 | $31,500 | $138,310 |
| 2017 | $5,638 | $171,160 | $31,500 | $139,660 |
| 2016 | $5,968 | $181,170 | $31,500 | $149,670 |
| 2015 | $1,946 | $174,320 | $31,500 | $142,820 |
| 2014 | $2,036 | $161,170 | $30,000 | $131,170 |
Source: Public Records
Map
Nearby Homes
- 2926 Coral Berry Ct
- 2951 Coral Berry Ct
- 2811 Cone Flower Dr
- 23814 Pullin Market Dr
- 23743 Travers Hill Rd
- 1311 Hudgins Pass
- 7034 Glennwick Grove Ln
- 809 Cardinal Flower Dr
- 23719 Sweeny Valley Dr
- 2918 Persimmon Grove
- 23714 Sweeny Valley Dr
- 1022 Majestic Oak
- 1622 Boone Hollow Ln
- 24323 Rose Cobbler Dr
- 24331 Dyer Hill Way
- 1415 Stuart Run Dr
- 2236 Par Ln
- 1115 Majestic Oak
- 24007 Barnett Overlook
- 24351 Dyer Hill Way
- 2923 Cone Flower Dr
- 2931 Cone Flower Dr
- 2935 Cone Flower Dr
- 2919 Cone Flower Dr
- 2939 Cone Flower Dr
- 2915 Cone Flower Dr
- 23736 Mock Wagon Way
- 2911 Cone Flower Dr
- 2943 Cone Flower Dr
- 2922 Cone Flower Dr
- 2926 Cone Flower Dr
- 2930 Cone Flower Dr
- 2918 Cone Flower Dr
- 2934 Cone Flower Dr
- 2914 Cone Flower Dr
- 2907 Cone Flower Dr
- 2947 Cone Flower Dr
- 23743 Mock Wagon Way
- 23739 Mock Wagon Way
- 2938 Cone Flower Dr