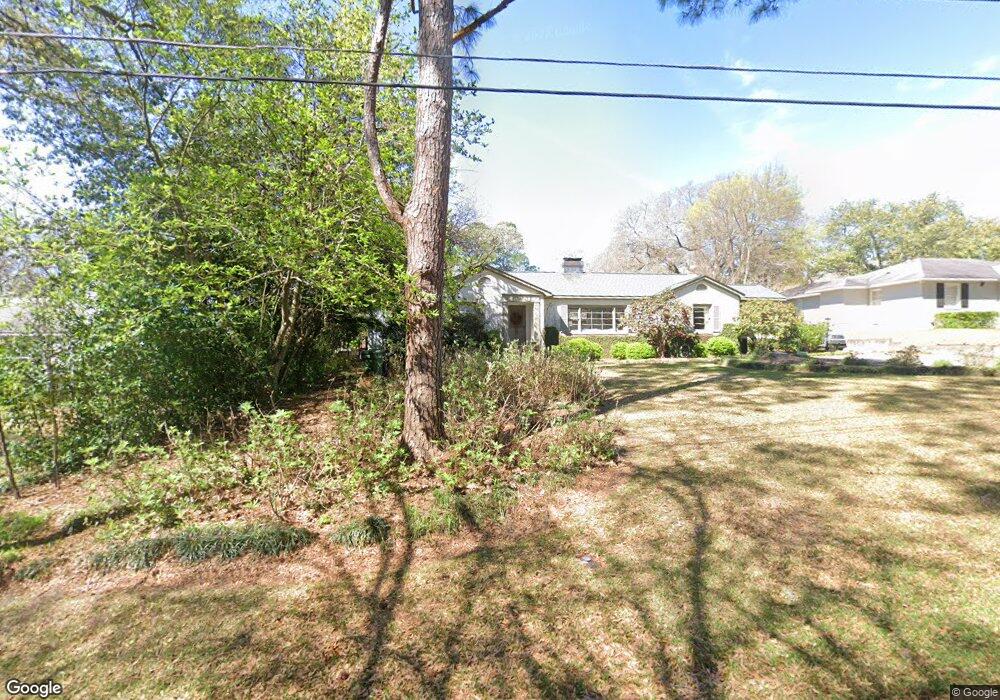
2927 Ethel Ave Columbus, GA 31906
Hilton Heights-Clubview Heights NeighborhoodEstimated Value: $438,000 - $487,000
3
Beds
3
Baths
2,665
Sq Ft
$172/Sq Ft
Est. Value
About This Home
This home is located at 2927 Ethel Ave, Columbus, GA 31906 and is currently estimated at $457,187, approximately $171 per square foot. 2927 Ethel Ave is a home located in Muscogee County with nearby schools including Clubview Elementary School, Richards Middle School, and Hardaway High School.
Ownership History
Date
Name
Owned For
Owner Type
Purchase Details
Closed on
Jun 29, 2021
Sold by
Pease Kathleen
Bought by
Carroll Andrew Kennedy
Current Estimated Value
Home Financials for this Owner
Home Financials are based on the most recent Mortgage that was taken out on this home.
Original Mortgage
$285,680
Outstanding Balance
$259,210
Interest Rate
2.9%
Mortgage Type
New Conventional
Estimated Equity
$197,977
Purchase Details
Closed on
Jun 3, 2016
Sold by
Mann Troy P
Bought by
Pease Kathleen
Home Financials for this Owner
Home Financials are based on the most recent Mortgage that was taken out on this home.
Original Mortgage
$74,000
Interest Rate
3.61%
Purchase Details
Closed on
Oct 21, 2011
Sold by
Jackson Alice Farrar
Bought by
Mann Troy P
Home Financials for this Owner
Home Financials are based on the most recent Mortgage that was taken out on this home.
Original Mortgage
$162,000
Interest Rate
4.16%
Create a Home Valuation Report for This Property
The Home Valuation Report is an in-depth analysis detailing your home's value as well as a comparison with similar homes in the area
Home Values in the Area
Average Home Value in this Area
Purchase History
| Date | Buyer | Sale Price | Title Company |
|---|---|---|---|
| Carroll Andrew Kennedy | $357,100 | -- | |
| Pease Kathleen | $249,000 | -- | |
| Mann Troy P | $162,500 | -- |
Source: Public Records
Mortgage History
| Date | Status | Borrower | Loan Amount |
|---|---|---|---|
| Open | Carroll Andrew Kennedy | $285,680 | |
| Previous Owner | Pease Kathleen | $74,000 | |
| Previous Owner | Mann Troy P | $162,000 |
Source: Public Records
Tax History Compared to Growth
Tax History
| Year | Tax Paid | Tax Assessment Tax Assessment Total Assessment is a certain percentage of the fair market value that is determined by local assessors to be the total taxable value of land and additions on the property. | Land | Improvement |
|---|---|---|---|---|
| 2025 | $5,815 | $161,740 | $17,976 | $143,764 |
| 2024 | $5,814 | $161,740 | $17,976 | $143,764 |
| 2023 | $637 | $161,740 | $17,976 | $143,764 |
| 2022 | $5,263 | $128,896 | $17,976 | $110,920 |
| 2021 | $3,276 | $80,228 | $17,976 | $62,252 |
| 2020 | $3,277 | $80,228 | $17,976 | $62,252 |
| 2019 | $3,287 | $80,228 | $17,976 | $62,252 |
| 2018 | $3,287 | $80,228 | $17,976 | $62,252 |
| 2017 | $3,140 | $67,976 | $17,976 | $50,000 |
| 2016 | $2,302 | $69,076 | $13,000 | $56,076 |
| 2015 | $2,305 | $69,076 | $13,000 | $56,076 |
| 2014 | $2,309 | $69,076 | $13,000 | $56,076 |
| 2013 | -- | $69,076 | $13,000 | $56,076 |
Source: Public Records
Map
Nearby Homes
- 2820 Nancy St
- 2645 Edgewood Rd
- 3402 Cambridge Dr
- 2609 Hilton Ave
- 2930 Sue MacK Dr
- 2220 Country Club Rd
- 2637 Sue MacK Dr
- 2942 Mary Ann Dr
- 3232 Hillside Way
- 2257 Camille Dr
- 2604 Sue MacK Dr
- 2369 Gurley Dr
- 2365 Gurley Dr
- 2345 Gurley Dr
- 3600 23rd Ave
- 3305 Cherokee Ave
- 3604 23rd Ave
- 2021 Elgin Dr
- 2010 Wells Dr
- 3303 Meadowbrook Dr
- 2919 Ethel Ave
- 2929 Ethel Ave
- 2928 Cathryn Dr
- 3004 Cathryn Dr
- 2920 Cathryn Dr
- 2911 Ethel Ave
- 2928 Ethel Ave
- 2920 Ethel Ave
- 2518 Lookout Dr
- 3010 Ethel Ave
- 2912 Ethel Ave
- 2500 Lookout Dr
- 2903 Ethel Ave
- 2505 Nancy St
- 2606 Lookout Dr
- 3001 Meadowview Dr
- 2904 Ethel Ave
- 2925 Cathryn Dr
- 3011 Meadowview Dr
- 2919 Meadowview Dr