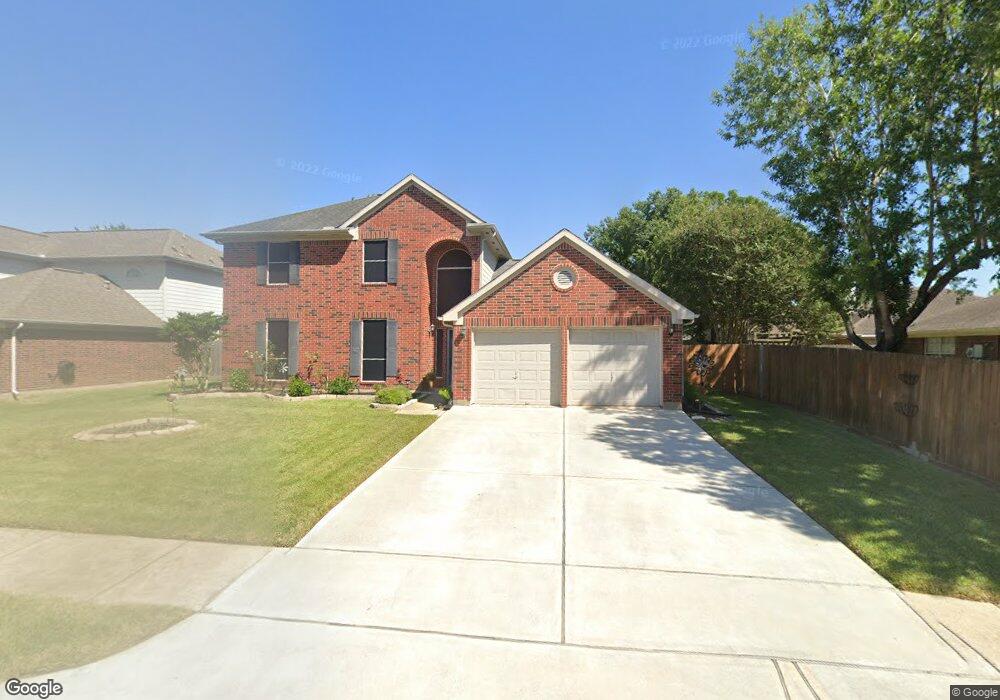
2927 Russett Place W Pearland, TX 77584
Southwyck NeighborhoodEstimated Value: $302,000 - $350,000
4
Beds
3
Baths
2,343
Sq Ft
$141/Sq Ft
Est. Value
About This Home
This home is located at 2927 Russett Place W, Pearland, TX 77584 and is currently estimated at $330,609, approximately $141 per square foot. 2927 Russett Place W is a home located in Brazoria County with nearby schools including Silverlake Elementary School, Rogers Middle School, and Berry Miller Junior High School.
Ownership History
Date
Name
Owned For
Owner Type
Purchase Details
Closed on
Jan 3, 2014
Sold by
Maxwell Bonita
Bought by
Ledbetter Patrick and Ledbetter Sharon
Current Estimated Value
Home Financials for this Owner
Home Financials are based on the most recent Mortgage that was taken out on this home.
Original Mortgage
$173,544
Outstanding Balance
$130,360
Interest Rate
4.26%
Mortgage Type
VA
Estimated Equity
$200,249
Purchase Details
Closed on
Dec 14, 2012
Sold by
Hiltabrand Thomas Jay and Hiltabrand Leslie
Bought by
Maxwell Bonita G
Home Financials for this Owner
Home Financials are based on the most recent Mortgage that was taken out on this home.
Original Mortgage
$157,003
Interest Rate
3.5%
Mortgage Type
FHA
Purchase Details
Closed on
Nov 24, 1993
Sold by
General Homes Corp
Bought by
Hiltabrand Thomas Jay and Hiltabrand Leslie Renee
Home Financials for this Owner
Home Financials are based on the most recent Mortgage that was taken out on this home.
Original Mortgage
$106,250
Interest Rate
7.19%
Create a Home Valuation Report for This Property
The Home Valuation Report is an in-depth analysis detailing your home's value as well as a comparison with similar homes in the area
Home Values in the Area
Average Home Value in this Area
Purchase History
| Date | Buyer | Sale Price | Title Company |
|---|---|---|---|
| Ledbetter Patrick | -- | Startex Title Company | |
| Maxwell Bonita G | -- | First American Title | |
| Hiltabrand Thomas Jay | -- | -- |
Source: Public Records
Mortgage History
| Date | Status | Borrower | Loan Amount |
|---|---|---|---|
| Open | Ledbetter Patrick | $173,544 | |
| Previous Owner | Maxwell Bonita G | $157,003 | |
| Previous Owner | Hiltabrand Thomas Jay | $106,250 |
Source: Public Records
Tax History Compared to Growth
Tax History
| Year | Tax Paid | Tax Assessment Tax Assessment Total Assessment is a certain percentage of the fair market value that is determined by local assessors to be the total taxable value of land and additions on the property. | Land | Improvement |
|---|---|---|---|---|
| 2025 | $5,082 | $331,430 | $70,460 | $260,970 |
| 2023 | $5,082 | $282,220 | $70,460 | $264,120 |
| 2022 | $6,172 | $256,564 | $30,030 | $267,890 |
| 2021 | $6,009 | $255,230 | $30,030 | $225,200 |
| 2020 | $5,721 | $221,240 | $27,260 | $193,980 |
| 2019 | $5,202 | $192,760 | $23,100 | $169,660 |
| 2018 | $5,370 | $199,860 | $23,100 | $176,760 |
| 2017 | $5,397 | $199,860 | $23,100 | $176,760 |
| 2016 | $5,039 | $201,990 | $23,100 | $178,890 |
| 2014 | $3,926 | $157,510 | $23,100 | $134,410 |
Source: Public Records
Map
Nearby Homes
- 4527 Brookren Ct
- 2815 Abbey Field Dr
- 3326 Lakeway Ln
- 3255 Lakeway Ln
- 4311 Duesenberg Ct
- 4838 Pinder Ln
- 18685 Tree Top Ln
- 18660 Tree Top Ln
- 4622 Pecan Grove Dr
- 3901 Magnolia Pkwy
- 2826 Foxden Dr
- 4915 Pecan Grove Dr
- 0 Cullen Pkwy Unit 80720255
- 4026 Bentley Dr
- 4811 Meadowglen Dr
- 8335 Fite Rd
- 4146 S Webber Dr
- 3021 Rocky Point Dr
- 2534 Oak Rd
- 2526 Oak Rd
- 2923 Russett Place W
- 4503 Russett Place S
- 4507 Russett Place S
- 4503 Brookren Ct
- 2919 Russett Place W
- 2926 Russett Place W
- 2922 Russett Place W
- 2930 Russett Place W
- 4507 Brookren Ct
- 4502 Brookren Ct
- 2915 Russett Place W
- 4603 Russett Place S
- 2934 Russett Place W
- 2918 Russett Place W
- 4511 Brookren Ct
- 2938 Russett Place W
- 2914 Russett Place W
- 4502 Russett Place S
- 4506 Russett Place S
- 4607 Russett Place S