Estimated Value: $401,461 - $451,000
4
Beds
1
Bath
1,524
Sq Ft
$281/Sq Ft
Est. Value
About This Home
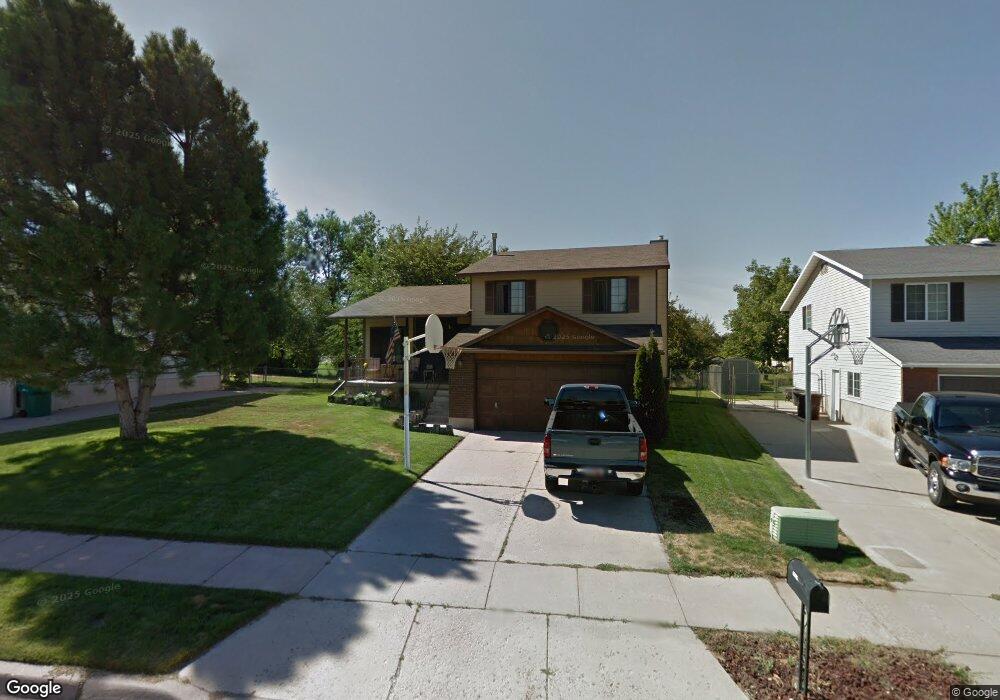
This home is located at 2927 W 5775 S, Roy, UT 84067 and is currently estimated at $428,365, approximately $281 per square foot. 2927 W 5775 S is a home located in Weber County with nearby schools including Roy Elementary School, Roy Junior High School, and Roy High School.
Ownership History
Date
Name
Owned For
Owner Type
Purchase Details
Closed on
Aug 22, 2019
Sold by
Turck Gary D and Turck Kerry L
Bought by
Turck Gary D and Turck Kerry L
Current Estimated Value
Purchase Details
Closed on
Jan 28, 1999
Sold by
Hud
Bought by
Turck Gary D
Home Financials for this Owner
Home Financials are based on the most recent Mortgage that was taken out on this home.
Original Mortgage
$56,500
Interest Rate
6.63%
Mortgage Type
Purchase Money Mortgage
Purchase Details
Closed on
Jun 11, 1998
Sold by
Burwig Andy and Burwig Debbie K
Bought by
Chase Mtg Services Inc
Purchase Details
Closed on
May 27, 1998
Sold by
Chase Mtg Services Inc
Bought by
Hud
Create a Home Valuation Report for This Property
The Home Valuation Report is an in-depth analysis detailing your home's value as well as a comparison with similar homes in the area
Home Values in the Area
Average Home Value in this Area
Purchase History
| Date | Buyer | Sale Price | Title Company |
|---|---|---|---|
| Turck Gary D | -- | None Available | |
| Turck Gary D | -- | U S Title | |
| Chase Mtg Services Inc | $100,618 | Backman Stewart Title | |
| Hud | -- | Backman Stewart Title |
Source: Public Records
Mortgage History
| Date | Status | Borrower | Loan Amount |
|---|---|---|---|
| Closed | Turck Gary D | $56,500 |
Source: Public Records
Tax History Compared to Growth
Tax History
| Year | Tax Paid | Tax Assessment Tax Assessment Total Assessment is a certain percentage of the fair market value that is determined by local assessors to be the total taxable value of land and additions on the property. | Land | Improvement |
|---|---|---|---|---|
| 2025 | $2,596 | $411,244 | $116,194 | $295,050 |
| 2024 | $2,521 | $221,099 | $62,780 | $158,319 |
| 2023 | $2,475 | $217,800 | $64,368 | $153,432 |
| 2022 | $2,605 | $237,050 | $55,771 | $181,279 |
| 2021 | $2,064 | $307,000 | $68,696 | $238,304 |
| 2020 | $1,914 | $261,000 | $68,696 | $192,304 |
| 2019 | $1,806 | $231,000 | $40,871 | $190,129 |
| 2018 | $1,699 | $204,000 | $39,049 | $164,951 |
| 2017 | $1,557 | $174,000 | $39,049 | $134,951 |
| 2016 | $1,571 | $94,983 | $19,414 | $75,569 |
| 2015 | $1,357 | $82,903 | $19,414 | $63,489 |
| 2014 | $1,369 | $82,903 | $19,414 | $63,489 |
Source: Public Records
Map
Nearby Homes