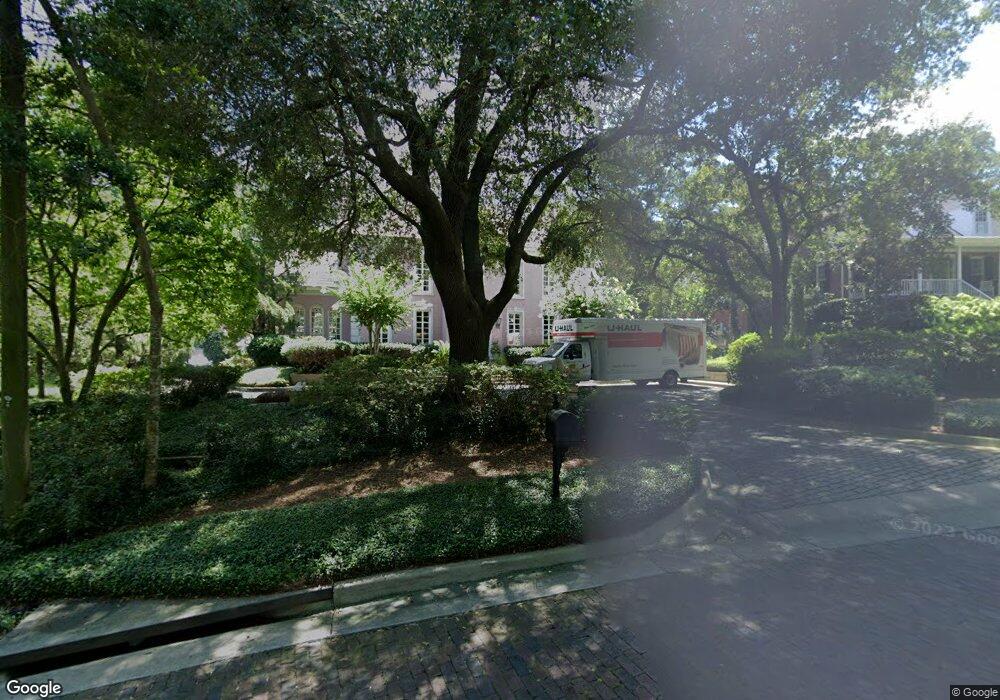
2928 Bransford Rd Augusta, GA 30909
Forest Hills NeighborhoodEstimated Value: $491,000 - $836,000
4
Beds
4
Baths
3,698
Sq Ft
$194/Sq Ft
Est. Value
About This Home
This home is located at 2928 Bransford Rd, Augusta, GA 30909 and is currently estimated at $718,662, approximately $194 per square foot. 2928 Bransford Rd is a home located in Richmond County with nearby schools including R.B. Hunt Elementary School, Lake Forest Hills Elementary School, and Langford Middle School.
Create a Home Valuation Report for This Property
The Home Valuation Report is an in-depth analysis detailing your home's value as well as a comparison with similar homes in the area
Home Values in the Area
Average Home Value in this Area
Tax History Compared to Growth
Tax History
| Year | Tax Paid | Tax Assessment Tax Assessment Total Assessment is a certain percentage of the fair market value that is determined by local assessors to be the total taxable value of land and additions on the property. | Land | Improvement |
|---|---|---|---|---|
| 2025 | $3,554 | $316,332 | $37,574 | $278,758 |
| 2024 | $3,554 | $290,296 | $37,574 | $252,722 |
| 2023 | $3,322 | $304,876 | $37,574 | $267,302 |
| 2022 | $3,520 | $253,200 | $37,574 | $215,626 |
| 2021 | $8,575 | $251,090 | $37,574 | $213,516 |
| 2020 | $6,540 | $193,598 | $37,574 | $156,024 |
| 2019 | $6,951 | $192,539 | $37,574 | $154,965 |
| 2018 | $6,957 | $191,027 | $37,574 | $153,453 |
| 2017 | $6,919 | $191,027 | $37,574 | $153,453 |
| 2016 | $6,923 | $191,028 | $37,574 | $153,453 |
| 2015 | $6,971 | $191,028 | $37,574 | $153,453 |
| 2014 | $6,978 | $191,028 | $37,574 | $153,453 |
Source: Public Records
Map
Nearby Homes
- 3011 Fox Spring Rd
- 2875 Lake Forest Dr
- 3348 Walton Way
- 3012 Walton Way
- 2904 Lombardy Ct
- 814 Windsor Ct
- 2923 Henry St
- 600 Bransford Rd
- 3013 Cardinal Dr
- 2812 Helen St
- 2818 Hazel St
- 1117 Highland Ave
- 2816 Royal St
- 712 Westminster Ct
- 2716 Hazel St
- 3134 Switzer Dr
- 1425 Glenn Ave
- 904 Highland Ave
- 542 Basin St
- 543 Basin St
- 2926 Bransford Rd
- 2930 Bransford Rd
- 3007 Bransford Rd
- 2921 Lake Forest Dr
- 3005 Bransford Rd
- 3009 Bransford Rd
- 2923 Lake Forest Dr
- 2923 Lake
- 2922 Bransford Rd
- 3011 Bransford Rd
- 2919 Lake Forest Dr
- 3004 Bransford Rd
- 3001 Bransford Rd
- 2925 Lake Forest Dr
- 3000 Bransford Rd
- 2915 Lake Forest Dr
- 3006 Bransford Rd
- 2927 Lake Forest Dr
- 2915 Lake
- 2913 Lake Forest Dr