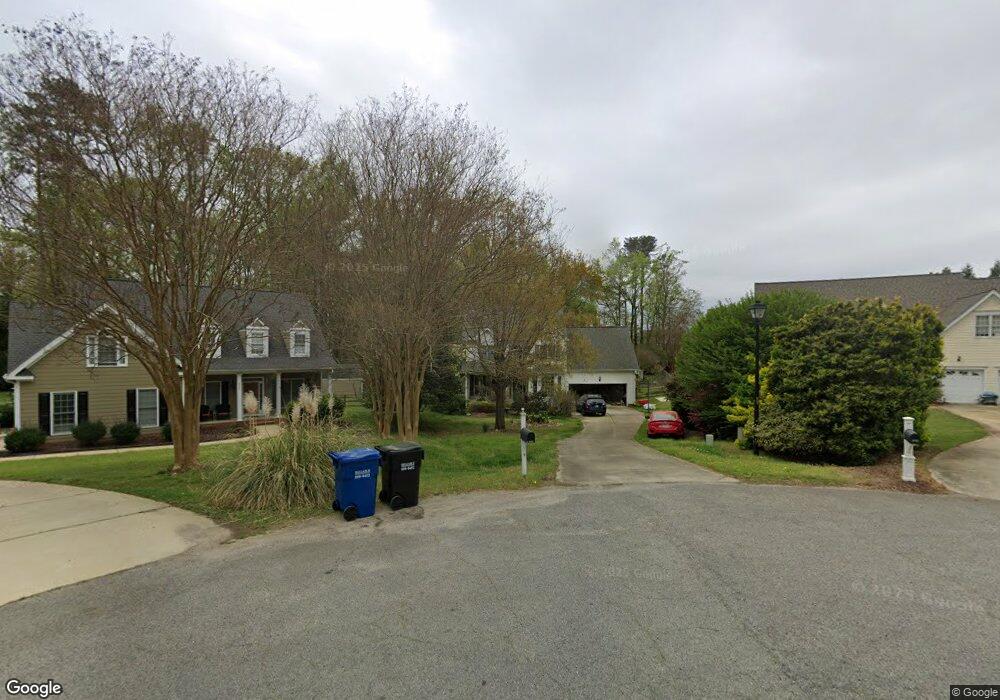
2928 Cortland Dr Apex, NC 27539
Middle Creek NeighborhoodEstimated Value: $535,000 - $599,000
3
Beds
3
Baths
2,060
Sq Ft
$274/Sq Ft
Est. Value
About This Home
This home is located at 2928 Cortland Dr, Apex, NC 27539 and is currently estimated at $564,417, approximately $273 per square foot. 2928 Cortland Dr is a home located in Wake County with nearby schools including Yates Mill Elementary School, Dillard Drive Magnet Middle School, and Middle Creek High.
Ownership History
Date
Name
Owned For
Owner Type
Purchase Details
Closed on
Sep 20, 2002
Sold by
Gentry Enterprises Inc
Bought by
Karoly Edward and Karoly Cynthia
Current Estimated Value
Home Financials for this Owner
Home Financials are based on the most recent Mortgage that was taken out on this home.
Original Mortgage
$203,600
Outstanding Balance
$85,423
Interest Rate
6.3%
Estimated Equity
$478,994
Purchase Details
Closed on
Feb 22, 2002
Sold by
Rbc Centura Bank
Bought by
Gentry Enterprises Inc
Home Financials for this Owner
Home Financials are based on the most recent Mortgage that was taken out on this home.
Original Mortgage
$145,000
Interest Rate
6.81%
Purchase Details
Closed on
Dec 21, 2001
Sold by
A C Coleman Construction Co Inc
Bought by
Rbc Centura Bank
Purchase Details
Closed on
Oct 22, 1998
Sold by
John S Rose Building Inc
Bought by
A C Coleman Construction Co Inc
Home Financials for this Owner
Home Financials are based on the most recent Mortgage that was taken out on this home.
Original Mortgage
$34,000
Interest Rate
6.76%
Create a Home Valuation Report for This Property
The Home Valuation Report is an in-depth analysis detailing your home's value as well as a comparison with similar homes in the area
Home Values in the Area
Average Home Value in this Area
Purchase History
| Date | Buyer | Sale Price | Title Company |
|---|---|---|---|
| Karoly Edward | $210,000 | -- | |
| Gentry Enterprises Inc | $117,000 | -- | |
| Rbc Centura Bank | $120,000 | -- | |
| A C Coleman Construction Co Inc | $34,000 | -- |
Source: Public Records
Mortgage History
| Date | Status | Borrower | Loan Amount |
|---|---|---|---|
| Open | Karoly Edward | $203,600 | |
| Previous Owner | Gentry Enterprises Inc | $145,000 | |
| Previous Owner | A C Coleman Construction Co Inc | $34,000 |
Source: Public Records
Tax History Compared to Growth
Tax History
| Year | Tax Paid | Tax Assessment Tax Assessment Total Assessment is a certain percentage of the fair market value that is determined by local assessors to be the total taxable value of land and additions on the property. | Land | Improvement |
|---|---|---|---|---|
| 2025 | $3,311 | $514,593 | $190,000 | $324,593 |
| 2024 | $3,216 | $514,593 | $190,000 | $324,593 |
| 2023 | $2,611 | $332,246 | $86,000 | $246,246 |
| 2022 | $2,419 | $332,246 | $86,000 | $246,246 |
| 2021 | $2,355 | $332,246 | $86,000 | $246,246 |
| 2020 | $2,316 | $332,246 | $86,000 | $246,246 |
| 2019 | $2,277 | $276,364 | $86,000 | $190,364 |
| 2018 | $2,094 | $276,364 | $86,000 | $190,364 |
| 2017 | $1,985 | $276,364 | $86,000 | $190,364 |
| 2016 | $1,945 | $276,364 | $86,000 | $190,364 |
| 2015 | $1,881 | $268,031 | $78,000 | $190,031 |
| 2014 | $1,784 | $268,031 | $78,000 | $190,031 |
Source: Public Records
Map
Nearby Homes
- 6002 Churchill Falls Place
- 8004 Churchill Falls Place
- 1817 Lost Creek Ct
- 6704 Orchard Knoll Dr
- 1305 Commons Ford Place
- 3901 Bamburgh Ln
- 3428 Hardwood Dr
- 200 Vintage Hill Cir
- 404 Vintage Hill Cir
- 1029 Dozier Way
- 1108 Bradshaw Ct
- 1032 Dozier Way
- 4036 Chaumont Dr
- 3013 Ivory Bluff Trail
- 3916 Grandbridge Dr
- 6001 Atkins Farm Ct
- 713 Churton Place
- 3628 Jamison Park Dr
- 4400 Surry Ridge Cir
- 4313 Hawksong Place
- 2924 Cortland Dr
- 2925 Cortland Dr
- 809 Cambridge Hall Loop Unit L13
- 809 Cambridge Hall Loop
- 807 Cambridge Hall Loop
- 811 Cambridge Hall Loop Unit L14
- 811 Cambridge Hall Loop
- 3509 Meadowhaven Dr
- 805 Cambridge Hall Loop
- 805 Cambridge Hall Loop Unit 11
- 2921 Cortland Dr
- 3708 Lucky Dr
- 803 Cambridge Hall Loop
- 803 Cambridge Hall Loop Unit 10
- 3712 Lucky Dr
- 2917 Cortland Dr
- 901 Cambridge Hall Loop
- 3704 Lucky Dr
- 801 Cambridge Hall Loop
- 801 Cambridge Hall Loop Unit 9