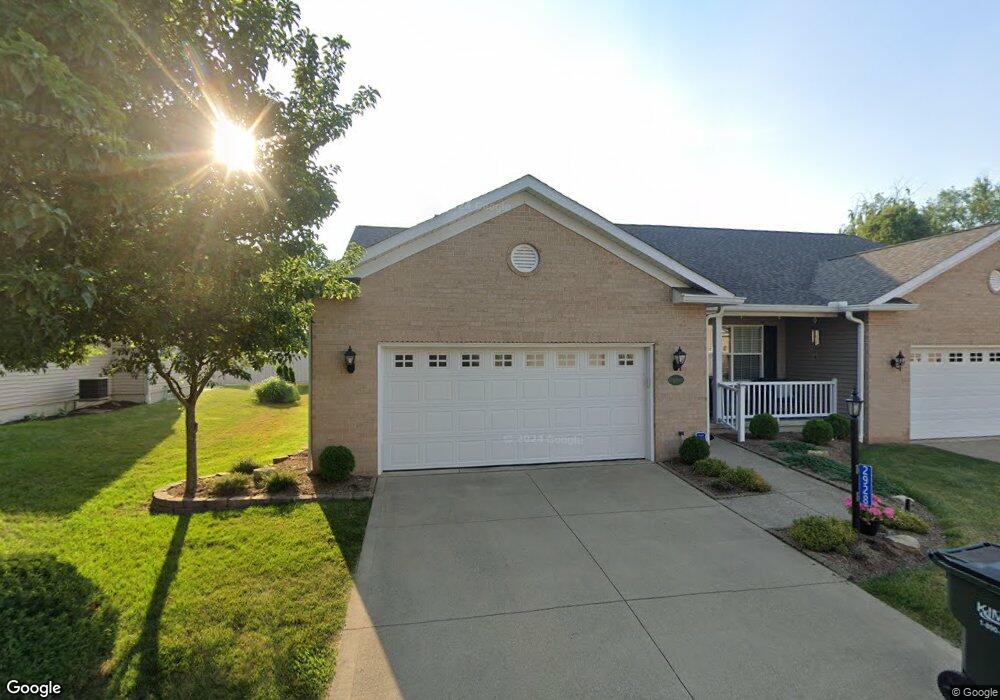
2928 Fasnacht Cir NW Unit 16 Massillon, OH 44646
Estimated Value: $223,000 - $260,000
2
Beds
2
Baths
1,560
Sq Ft
$154/Sq Ft
Est. Value
About This Home
This home is located at 2928 Fasnacht Cir NW Unit 16, Massillon, OH 44646 and is currently estimated at $240,763, approximately $154 per square foot. 2928 Fasnacht Cir NW Unit 16 is a home located in Stark County with nearby schools including Pfeiffer Intermediate School, Edison Middle School, and Perry High School.
Ownership History
Date
Name
Owned For
Owner Type
Purchase Details
Closed on
Jan 7, 2022
Sold by
Gault Clouse Dorothy J
Bought by
Schembechler Raymond Anthony and Schembechler Margaret Louise
Current Estimated Value
Home Financials for this Owner
Home Financials are based on the most recent Mortgage that was taken out on this home.
Original Mortgage
$168,000
Outstanding Balance
$132,201
Interest Rate
2.34%
Mortgage Type
New Conventional
Estimated Equity
$108,562
Purchase Details
Closed on
Jun 10, 2015
Sold by
Wood Timothy J
Bought by
Clouse Louis G and Gault Clouse Dorothy J
Purchase Details
Closed on
Dec 13, 2012
Sold by
Mattachione Doris M and Wood Timothy J
Bought by
The Doris M Mattachione Revocable Living
Purchase Details
Closed on
May 9, 2005
Sold by
The Commons Development Llc
Bought by
Mattachione Pat F and Mattachione Doris M
Create a Home Valuation Report for This Property
The Home Valuation Report is an in-depth analysis detailing your home's value as well as a comparison with similar homes in the area
Home Values in the Area
Average Home Value in this Area
Purchase History
| Date | Buyer | Sale Price | Title Company |
|---|---|---|---|
| Schembechler Raymond Anthony | $213,000 | Patriot Title Agency Inc | |
| Clouse Louis G | $133,500 | None Available | |
| The Doris M Mattachione Revocable Living | -- | None Available | |
| Mattachione Pat F | $159,900 | -- |
Source: Public Records
Mortgage History
| Date | Status | Borrower | Loan Amount |
|---|---|---|---|
| Open | Schembechler Raymond Anthony | $168,000 |
Source: Public Records
Tax History Compared to Growth
Tax History
| Year | Tax Paid | Tax Assessment Tax Assessment Total Assessment is a certain percentage of the fair market value that is determined by local assessors to be the total taxable value of land and additions on the property. | Land | Improvement |
|---|---|---|---|---|
| 2025 | -- | $74,550 | $12,390 | $62,160 |
| 2024 | -- | $74,550 | $12,390 | $62,160 |
| 2023 | $3,174 | $63,290 | $11,940 | $51,350 |
| 2022 | $3,259 | $63,290 | $11,940 | $51,350 |
| 2021 | $1,856 | $64,690 | $13,340 | $51,350 |
| 2020 | $2,730 | $57,650 | $10,680 | $46,970 |
| 2019 | $516 | $57,650 | $10,680 | $46,970 |
| 2018 | $2,438 | $57,650 | $10,680 | $46,970 |
| 2017 | $2,289 | $51,280 | $10,680 | $40,600 |
| 2016 | $2,302 | $51,280 | $10,680 | $40,600 |
| 2015 | $2,642 | $47,220 | $10,680 | $36,540 |
| 2014 | -- | $45,160 | $10,540 | $34,620 |
| 2013 | $1,299 | $45,160 | $10,540 | $34,620 |
Source: Public Records
Map
Nearby Homes
- 1545 Clearbrook Rd NW
- 951 Mill Ridge Path NE
- VL Mill Creek Run NE
- 2554 Mary Lou St NW
- 1760 Cadbury St NW
- 1001 27th St NE
- 000 Jackson Ave NW
- 937 27th St NE
- 1715 Jackson Ave NW
- 804 Jeffrey Ave NW
- 831 27th St NE
- 3460 Spindle St NW
- 3467 Briardale Dr NW
- 3103 Wattova Rd NW
- Aviano Plan at Aberdeen Oaks
- Hudson Plan at Aberdeen Oaks
- Allegheny Plan at Aberdeen Oaks
- Columbia Plan at Aberdeen Oaks
- 2406 Nottingham St NW
- 6436 Hensley St NW
- 2926 Fasnacht Cir NW Unit 15
- 2936 Fasnacht Cir NW Unit 13
- 2927 Fasnacht Cir NW Unit 21
- 2918 Fasnacht Cir NW Unit 18
- 2938 Fasnacht Cir NW Unit 14
- 2925 Fasnacht Cir NW Unit 20
- 2945 12th St NW
- 2935 Fasnacht Cir NW Unit 22
- 2916 Fasnacht Cir NW Unit 17
- 2937 Fasnacht Cir NW Unit 23
- 2917 Fasnacht Cir NW Unit 19
- 2849 Fasnacht Cir NW Unit 24
- 2938 12th St NW
- 2847 Fasnacht Cir NW Unit 25
- 2911 Fasnacht Cir NW Unit 28
- 2833 Fasnacht Cir NW
- 3003 12th St NW
- 2900 Fasnacht Cir NW Unit 30
- 2850 Fasnacht Cir NW Unit 31
- 2944 12th St NW