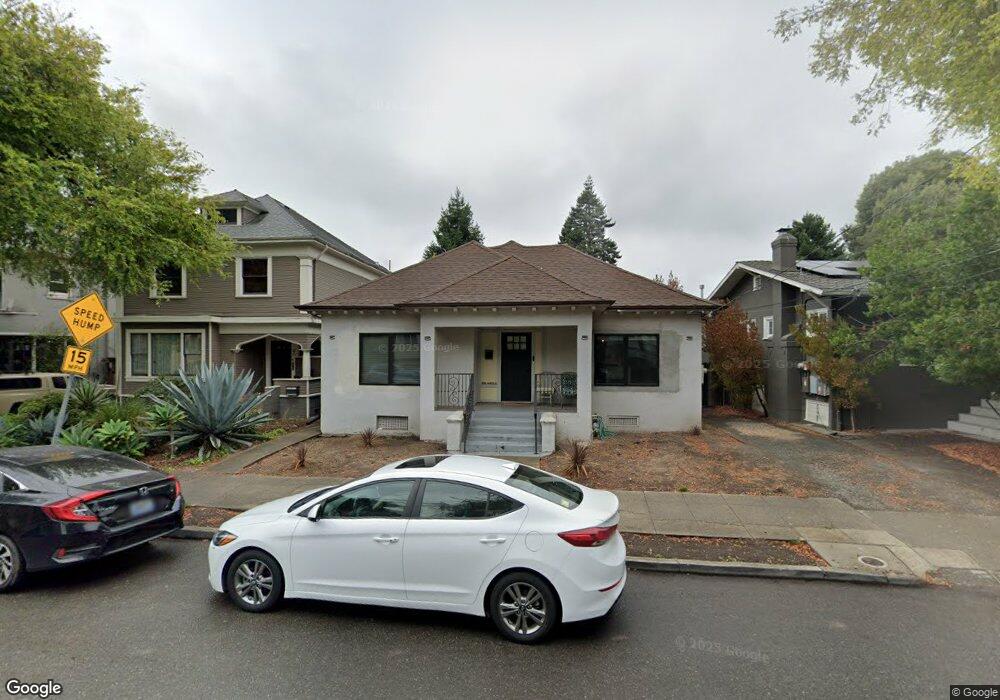
2928 Harper St Berkeley, CA 94703
South Berkeley NeighborhoodEstimated Value: $838,919 - $1,027,000
2
Beds
1
Bath
1,203
Sq Ft
$777/Sq Ft
Est. Value
About This Home
This home is located at 2928 Harper St, Berkeley, CA 94703 and is currently estimated at $934,230, approximately $776 per square foot. 2928 Harper St is a home located in Alameda County with nearby schools including Malcolm X Elementary School, Emerson Elementary School, and John Muir Elementary School.
Ownership History
Date
Name
Owned For
Owner Type
Purchase Details
Closed on
Oct 23, 2008
Sold by
Robinson Frenchie L
Bought by
Robinson Frenchie L and Blue Brenda
Current Estimated Value
Create a Home Valuation Report for This Property
The Home Valuation Report is an in-depth analysis detailing your home's value as well as a comparison with similar homes in the area
Home Values in the Area
Average Home Value in this Area
Purchase History
| Date | Buyer | Sale Price | Title Company |
|---|---|---|---|
| Robinson Frenchie L | -- | None Available |
Source: Public Records
Tax History
| Year | Tax Paid | Tax Assessment Tax Assessment Total Assessment is a certain percentage of the fair market value that is determined by local assessors to be the total taxable value of land and additions on the property. | Land | Improvement |
|---|---|---|---|---|
| 2025 | $3,072 | $40,318 | $29,911 | $17,407 |
| 2024 | $3,072 | $39,391 | $29,325 | $17,066 |
| 2023 | $2,981 | $45,481 | $28,750 | $16,731 |
| 2022 | $2,868 | $37,589 | $28,186 | $16,403 |
| 2021 | $2,833 | $36,716 | $27,634 | $16,082 |
| 2020 | $2,550 | $43,267 | $27,350 | $15,917 |
| 2019 | $2,302 | $42,419 | $26,814 | $15,605 |
| 2018 | $2,228 | $41,587 | $26,288 | $15,299 |
| 2017 | $2,111 | $40,772 | $25,773 | $14,999 |
| 2016 | $1,939 | $39,973 | $25,268 | $14,705 |
| 2015 | $3,273 | $39,372 | $24,888 | $14,484 |
| 2014 | $3,181 | $38,601 | $24,401 | $14,200 |
Source: Public Records
Map
Nearby Homes
- 2926 Ellis St
- 1610 Oregon St
- 1535 Julia St
- 1538 Ashby Ave
- 2727 McGee Ave
- 2701 Grant St
- 2045 Emerson St
- 2057 Emerson St
- 1530 Stuart St
- 1741 Derby St
- 3110 California St
- 3114 California St
- 1507 Prince St
- 3138 California St
- 2110 Ashby Ave
- 1612 Carleton St
- 3233 Ellis St
- 2790 Sacramento St
- 2782 Sacramento St
- 2774 Sacramento St
Your Personal Tour Guide
Ask me questions while you tour the home.