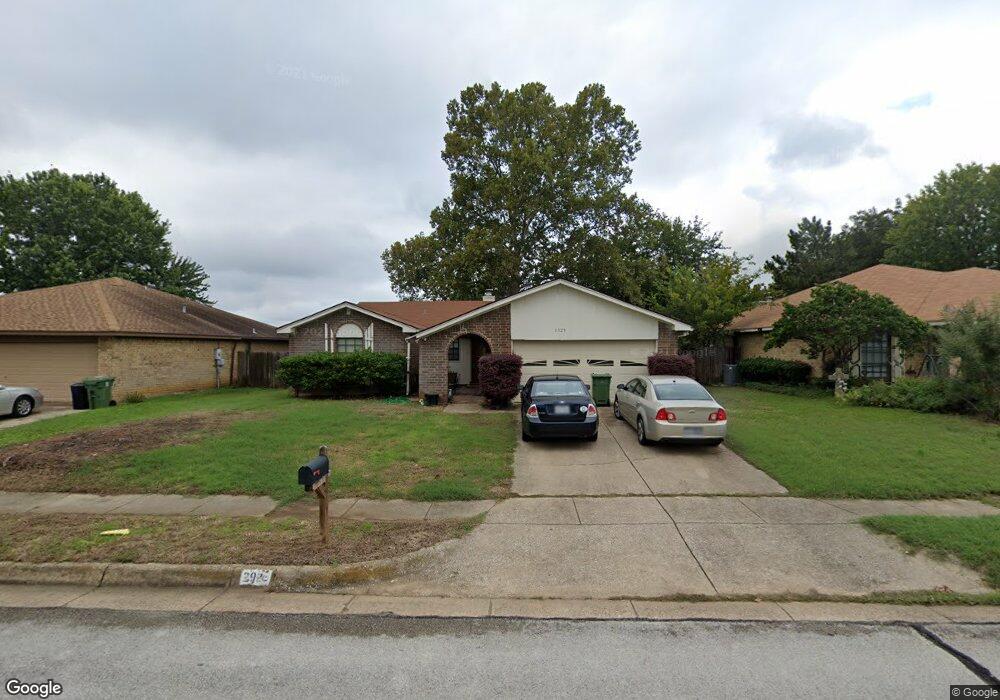
2929 Beachtree Ln Bedford, TX 76021
Estimated Value: $342,000 - $386,000
4
Beds
2
Baths
1,764
Sq Ft
$207/Sq Ft
Est. Value
About This Home
This home is located at 2929 Beachtree Ln, Bedford, TX 76021 and is currently estimated at $364,406, approximately $206 per square foot. 2929 Beachtree Ln is a home located in Tarrant County with nearby schools including Spring Garden Elementary School, Harwood Junior High School, and Trinity High School.
Ownership History
Date
Name
Owned For
Owner Type
Purchase Details
Closed on
May 20, 2025
Sold by
Open House Texas Realty & Investments Ll
Bought by
Sai Toshiyuki
Current Estimated Value
Purchase Details
Closed on
Jan 17, 2025
Sold by
Kanno Gen
Bought by
Open House Texas Realty & Investments Llc
Purchase Details
Closed on
Nov 25, 2019
Sold by
Open House Texas Rlty & Investments Llc
Bought by
Kanno Gen
Purchase Details
Closed on
Jul 18, 2019
Sold by
Middleton David L and Middleton Neladene R
Bought by
Open House Texas Rlty & Investments Llc
Purchase Details
Closed on
Feb 16, 2004
Sold by
Henke David A
Bought by
Middleton David L and Middleton Neladene R
Home Financials for this Owner
Home Financials are based on the most recent Mortgage that was taken out on this home.
Original Mortgage
$118,755
Interest Rate
5.86%
Mortgage Type
Purchase Money Mortgage
Create a Home Valuation Report for This Property
The Home Valuation Report is an in-depth analysis detailing your home's value as well as a comparison with similar homes in the area
Home Values in the Area
Average Home Value in this Area
Purchase History
| Date | Buyer | Sale Price | Title Company |
|---|---|---|---|
| Sai Toshiyuki | -- | Lawyers Title | |
| Open House Texas Realty & Investments Llc | -- | Lawyers Title | |
| Kanno Gen | -- | Lawyers Title | |
| Open House Texas Rlty & Investments Llc | -- | None Available | |
| Middleton David L | -- | North American |
Source: Public Records
Mortgage History
| Date | Status | Borrower | Loan Amount |
|---|---|---|---|
| Previous Owner | Middleton David L | $118,755 | |
| Closed | Kanno Gen | $0 |
Source: Public Records
Tax History Compared to Growth
Tax History
| Year | Tax Paid | Tax Assessment Tax Assessment Total Assessment is a certain percentage of the fair market value that is determined by local assessors to be the total taxable value of land and additions on the property. | Land | Improvement |
|---|---|---|---|---|
| 2025 | $6,405 | $310,000 | $75,000 | $235,000 |
| 2024 | $6,405 | $329,000 | $75,000 | $254,000 |
| 2023 | $6,466 | $337,101 | $45,000 | $292,101 |
| 2022 | $6,334 | $290,000 | $45,000 | $245,000 |
| 2021 | $5,206 | $221,000 | $45,000 | $176,000 |
| 2020 | $5,255 | $221,000 | $45,000 | $176,000 |
| 2019 | $4,834 | $243,836 | $45,000 | $198,836 |
| 2018 | $4,012 | $180,883 | $45,000 | $135,883 |
| 2017 | $3,978 | $205,231 | $18,000 | $187,231 |
| 2016 | $3,616 | $196,350 | $18,000 | $178,350 |
| 2015 | $3,138 | $135,900 | $18,000 | $117,900 |
| 2014 | $3,138 | $135,900 | $18,000 | $117,900 |
Source: Public Records
Map
Nearby Homes
- 2922 Beachtree Ln
- 2600 Willow Bend
- 2909 Oakridge Dr
- 3024 Highgate Ln
- 2616 Greenwood Ct
- 2521 Sanders Ct
- 2220 Tiffany Glenn Ct
- 2709 Willow Bend
- 3152 Woodbridge Dr
- 2516 Classic Ct W
- 2601 Murphy Dr
- 2609 Woodson Dr
- 2700 Mimosa Ct
- 2501 Murphy Dr
- 2417 Meadow Ct
- 3017 Bluebonnet Ln
- 3532 Meadowside Dr
- 3001 Glenwood Ct
- 2109 Oakmeadow St
- 3513 Meadowside Dr
- 2916 Turtlerock Dr
- 2920 Turtlerock Dr
- 2921 Beachtree Ln
- 2912 Turtlerock Dr
- 2937 Beachtree Ln
- 2930 Beachtree Ln
- 2924 Turtlerock Dr
- 2908 Turtlerock Dr
- 2934 Beachtree Ln
- 2926 Beachtree Ln
- 2917 Beachtree Ln
- 2938 Beachtree Ln
- 2904 Turtlerock Dr
- 2932 Turtlerock Dr
- 2928 Turtlerock Dr
- 2942 Beachtree Ln
- 2936 Turtlerock Dr
- 3017 Mossy Oak Ln
- 2917 Turtlerock Dr
- 2918 Beachtree Ln