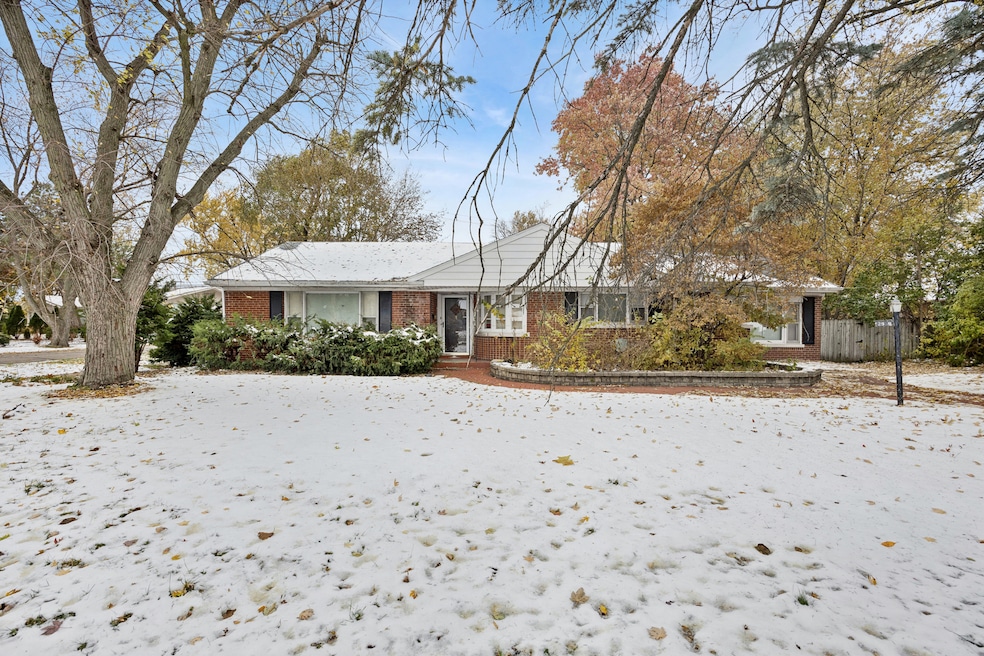

2929 Flossmoor Rd Flossmoor, IL 60422
Estimated payment $1,782/month
Highlights
- Ranch Style House
- Wood Flooring
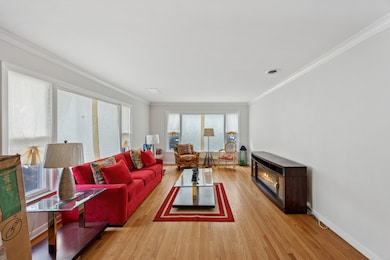
- Living Room
- Homewood-Flossmoor High School Rated A-
- Patio
- Laundry Room
About This Home
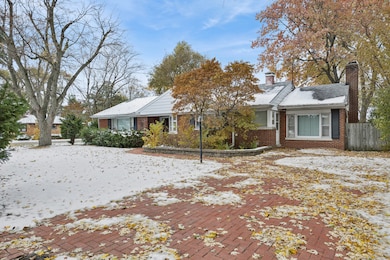
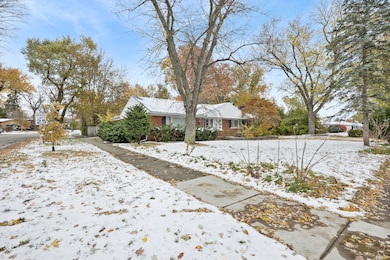
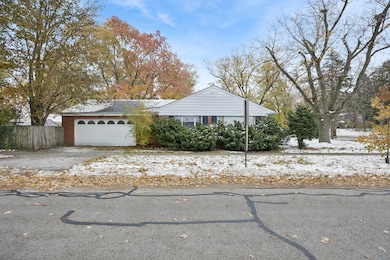
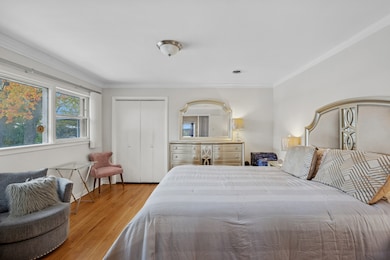
**Charming Ranch in Flossmoor Farms!** Welcome to this inviting home on a spacious corner lot in the desirable Flossmoor Farms neighborhood. This property features three bedrooms and 1.5 bathrooms, offering comfortable living with plenty of potential. Inside, you'll find hardwood floors, a spacious living room filled with natural light, and a cozy family room with a fireplace-perfect for relaxing or entertaining. The kitchen is equipped with stainless steel appliances, and the layout flows nicely into the living areas. Step outside to enjoy a large backyard with a fenced perimeter, a generous patio area, and even a partially enclosed section, ideal for year-round enjoyment. Additional highlights include an attached two-car garage and a location that's hard to beat-just blocks away from Homewood-Flossmoor High School, Parker Junior High, and Infant Jesus of Prague School. You'll also love being close to downtown Flossmoor, where you can enjoy shopping, dining, and convenient access to the Metra Train Station. This home needs a little TLC, but with its prime location and solid features, it's a fantastic opportunity to create your dream home in one of the area's most sought-after communities.
Home Details
Home Type
- Single Family
Est. Annual Taxes
- $7,527
Year Built
- Built in 1955
Lot Details
- 0.28 Acre Lot
- Lot Dimensions are 90 x 128 x 92 x128
- Paved or Partially Paved Lot
Parking
- 2 Car Garage
- Parking Included in Price
Home Design
- Ranch Style House
- Brick Exterior Construction
- Asphalt Roof
Interior Spaces
- 1,406 Sq Ft Home
- Family Room with Fireplace
- Living Room
- Dining Room
- Laundry Room
Flooring
- Wood
- Ceramic Tile
Bedrooms and Bathrooms
- 3 Bedrooms
- 3 Potential Bedrooms
Outdoor Features
- Patio
Utilities
- Forced Air Heating and Cooling System
- Heating System Uses Natural Gas
Listing and Financial Details
- Homeowner Tax Exemptions
Map
Home Values in the Area
Average Home Value in this Area
Tax History
| Year | Tax Paid | Tax Assessment Tax Assessment Total Assessment is a certain percentage of the fair market value that is determined by local assessors to be the total taxable value of land and additions on the property. | Land | Improvement |
|---|---|---|---|---|
| 2024 | $7,527 | $21,001 | $6,650 | $14,351 |
| 2023 | $6,104 | $21,001 | $6,650 | $14,351 |
| 2022 | $6,104 | $14,770 | $5,743 | $9,027 |
| 2021 | $6,163 | $14,768 | $5,742 | $9,026 |
| 2020 | $6,022 | $14,768 | $5,742 | $9,026 |
| 2019 | $7,364 | $13,665 | $5,138 | $8,527 |
| 2018 | $5,305 | $13,665 | $5,138 | $8,527 |
| 2017 | $5,239 | $13,665 | $5,138 | $8,527 |
| 2016 | $5,136 | $12,194 | $4,533 | $7,661 |
| 2015 | $5,093 | $12,194 | $4,533 | $7,661 |
| 2014 | $5,668 | $13,424 | $4,533 | $8,891 |
| 2013 | $5,946 | $15,074 | $4,533 | $10,541 |
Property History
| Date | Event | Price | List to Sale | Price per Sq Ft |
|---|---|---|---|---|
| 11/12/2025 11/12/25 | For Sale | $219,000 | -- | $156 / Sq Ft |
Purchase History
| Date | Type | Sale Price | Title Company |
|---|---|---|---|
| Warranty Deed | $150,000 | Fidelity National Title | |
| Sheriffs Deed | $76,000 | None Available | |
| Warranty Deed | -- | None Available | |
| Warranty Deed | $138,000 | -- |
Mortgage History
| Date | Status | Loan Amount | Loan Type |
|---|---|---|---|
| Open | $142,405 | New Conventional | |
| Previous Owner | $143,500 | Negative Amortization |
Source: Midwest Real Estate Data (MRED)
MLS Number: 12512027
APN: 31-01-307-004-0000
Disclaimer: Certain information contained herein is derived from information provided by parties other than Homes.com. All information provided is deemed reliable, but is not guaranteed to be accurate and should be independently verified.
![]() Based on information submitted to the MLS GRID. All data is obtained from various sources and may not have been verified by broker or MLS GRID. Supplied Open House Information is subject to change without notice. All information should be independently reviewed and verified for accuracy. Properties may or may not be listed by the office/agent presenting the information. Some IDX listings have been excluded from this website.
Based on information submitted to the MLS GRID. All data is obtained from various sources and may not have been verified by broker or MLS GRID. Supplied Open House Information is subject to change without notice. All information should be independently reviewed and verified for accuracy. Properties may or may not be listed by the office/agent presenting the information. Some IDX listings have been excluded from this website.
The Digital Millennium Copyright Act of 1998, 17 U.S.C. § 512 (the “DMCA”) provides recourse for copyright owners who believe that material appearing on the Internet infringes their rights under U.S. copyright law. If you believe in good faith that any content or material made available in connection with our website or services infringes your copyright, you (or your agent) may send us a notice requesting that the content or material be removed, or access to it blocked.
Notices must be sent in writing by email to DMCAnotice@MLSGrid.com.
The DMCA requires that your notice of alleged copyright infringement include the following information:
(1) description of the copyrighted work that is the subject of claimed infringement;
(2) description of the alleged infringing content and information sufficient to permit us to locate the content;
(3) contact information for you, including your address, telephone number and email address;
(4) a statement by you that you have a good faith belief that the content in the manner complained of is not authorized by the copyright owner, or its agent, or by the operation of any law;
(5) a statement by you, signed under penalty of perjury, that the information in the notification is accurate and that you have the authority to enforce the copyrights that are claimed to be infringed; and
(6) a physical or electronic signature of the copyright owner or a person authorized to act on the copyright owner’s behalf. Failure to include all of the above information may result in the delay of the processing of your complaint.
- 2931 Sunset Ave
- 2817 Flossmoor Rd
- 3037 Candlewood Ct
- 926 Braemar Rd
- 3118 Elaine Ct Unit 232
- 1248 Berry Ln
- 1248 Oakmont Ave
- 846 Park Dr
- 19020 Kedzie Ave
- 2640 Central Dr Unit 1-N
- 1139 Leavitt Ave Unit 212
- 1139 Leavitt Ave Unit 313
- 1117 Leavitt Ave Unit 110
- 1117 Leavitt Ave Unit 108
- 1141 Leavitt Ave Unit 115
- 2633 Hawthorne Ln Unit B
- 1402 Berry Ln
- 3045 Scott Crescent
- 3007 Monterey Dr
- 3232 Chestnut Dr
- 2909 Flossmoor Rd
- 2712 2nd Private Rd
- 3758 Cherry Hills Dr Unit ID1285063P
- 2049 Hagen Ln
- 18830 Hamlin Ave Unit ID1285064P
- 18101 Marlin Ln Unit ID1285717P
- 4014 193rd St Unit 102
- 18200 Fountainbleau Dr
- 1828 Idlewild Ln
- 2107 183rd St Unit 1
- 18951 Chestnut Ave
- 4135 193rd St Unit 268
- 18351 Dixie Hwy
- 18450 Homewood Ave
- 17950 Park Ave Unit B
- 17861 Princeton Ln
- 20408 Ithaca Rd
- 18328 Ashland Ave Unit ID1285049P
- 1601 183rd St Unit ID1237861P
- 2025 Maple Rd Unit 1E
