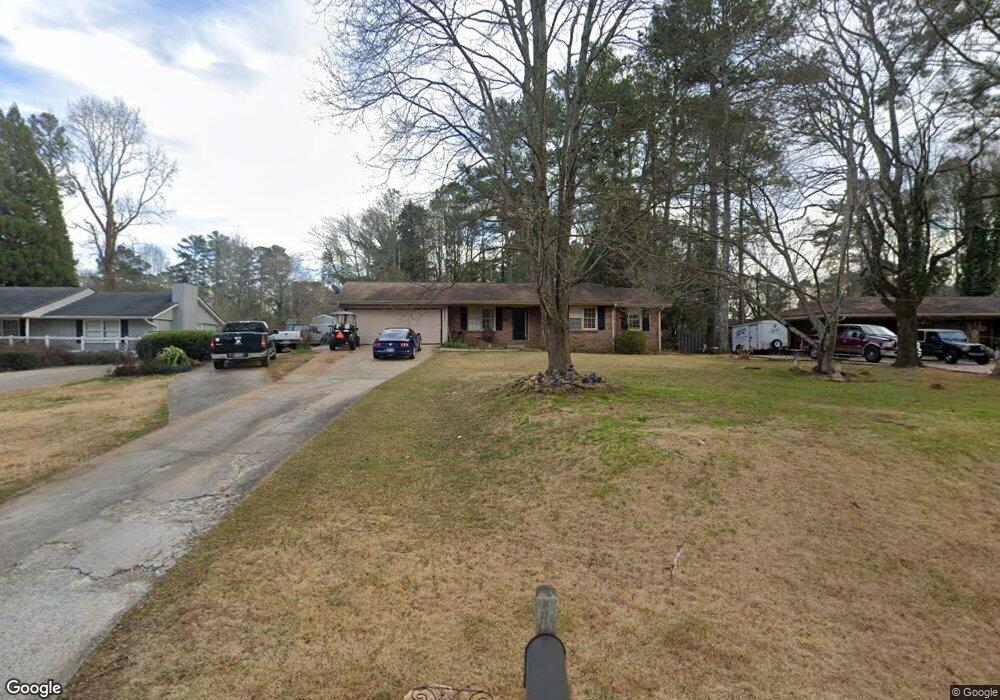
2929 Mockingbird Cir Duluth, GA 30096
Estimated Value: $336,000 - $355,000
2
Beds
2
Baths
1,285
Sq Ft
$267/Sq Ft
Est. Value
About This Home
This home is located at 2929 Mockingbird Cir, Duluth, GA 30096 and is currently estimated at $343,495, approximately $267 per square foot. 2929 Mockingbird Cir is a home located in Gwinnett County with nearby schools including B.B. Harris Elementary School, Duluth Middle School, and Duluth High School.
Ownership History
Date
Name
Owned For
Owner Type
Purchase Details
Closed on
May 31, 2016
Sold by
Kutner Stephen S
Bought by
Davidson Thomas W
Current Estimated Value
Home Financials for this Owner
Home Financials are based on the most recent Mortgage that was taken out on this home.
Original Mortgage
$161,148
Outstanding Balance
$127,727
Interest Rate
3.61%
Mortgage Type
VA
Estimated Equity
$215,768
Purchase Details
Closed on
Jul 9, 1999
Sold by
Kutner Stephen S
Bought by
Welch Chris and Welch Marlene
Home Financials for this Owner
Home Financials are based on the most recent Mortgage that was taken out on this home.
Original Mortgage
$131,877
Interest Rate
7.51%
Mortgage Type
New Conventional
Purchase Details
Closed on
Dec 11, 1997
Sold by
Kay James D and Kay Joyce E
Bought by
Penland Betty J
Home Financials for this Owner
Home Financials are based on the most recent Mortgage that was taken out on this home.
Original Mortgage
$110,550
Interest Rate
7.23%
Mortgage Type
New Conventional
Create a Home Valuation Report for This Property
The Home Valuation Report is an in-depth analysis detailing your home's value as well as a comparison with similar homes in the area
Home Values in the Area
Average Home Value in this Area
Purchase History
| Date | Buyer | Sale Price | Title Company |
|---|---|---|---|
| Davidson Thomas W | $156,000 | -- | |
| Welch Chris | $130,400 | -- | |
| Penland Betty J | $140,000 | -- |
Source: Public Records
Mortgage History
| Date | Status | Borrower | Loan Amount |
|---|---|---|---|
| Open | Davidson Thomas W | $161,148 | |
| Previous Owner | Welch Chris | $131,877 | |
| Previous Owner | Penland Betty J | $110,550 |
Source: Public Records
Tax History Compared to Growth
Tax History
| Year | Tax Paid | Tax Assessment Tax Assessment Total Assessment is a certain percentage of the fair market value that is determined by local assessors to be the total taxable value of land and additions on the property. | Land | Improvement |
|---|---|---|---|---|
| 2025 | $1,095 | $126,520 | $29,920 | $96,600 |
| 2024 | $1,093 | $115,120 | $29,200 | $85,920 |
| 2023 | $1,093 | $113,040 | $26,000 | $87,040 |
| 2022 | $1,052 | $108,120 | $26,000 | $82,120 |
| 2021 | $1,039 | $74,640 | $18,400 | $56,240 |
| 2020 | $1,037 | $74,640 | $18,400 | $56,240 |
| 2019 | $964 | $74,640 | $18,400 | $56,240 |
| 2018 | $946 | $70,640 | $18,400 | $52,240 |
| 2016 | $2,407 | $57,720 | $16,000 | $41,720 |
| 2015 | $2,183 | $50,880 | $16,000 | $34,880 |
| 2014 | -- | $51,240 | $16,000 | $35,240 |
Source: Public Records
Map
Nearby Homes
- 2888 Cardinal Trace
- 2829 Cardinal Trace
- 2976 Nelson Dr
- 3518 Tracey Dr
- 2702 Davenport Rd
- 2961 Creek Dr
- 3102 Claiborne Dr
- 3158 Onamia Rd
- 2644 Davenport Rd
- 3576 Highland Pine Way
- 3120 Saint Andrews Cir
- 3576 Randy Place
- 3355 Cresswell Link Way
- The Montgomery Plan at Evanshire - Carriage
- The Garwood Plan at Evanshire - Townhomes
- The Greenville Plan at Evanshire - Single Family
- The Madilyn Plan at Evanshire - Single Family
- The Hillsdale Plan at Evanshire - Arden
- The Wesley Plan at Evanshire - Meadowview
- The Mansfield Plan at Evanshire - Carriage
- 2931 Mockingbird Cir
- 2919 Mockingbird Cir
- 2939 Mockingbird Cir
- 2909 Mockingbird Cir
- 3371 Blue Jay Dr
- 3351 Blue Jay Dr
- 2932 Mockingbird Cir
- 2928 Mockingbird Cir Unit 8
- 3381 Blue Jay Dr
- 0 Peachtree Industrial Blvd Unit 3147632
- 0 Peachtree Industrial Blvd Unit 7418659
- 0 Peachtree Industrial Blvd Unit 7029816
- 0 Peachtree Industrial Blvd Unit 8063492
- 3341 Blue Jay Dr
- 2938 Mockingbird Cir
- 2922 Mockingbird Cir
- 2876 Mockingbird Cir
- 2879 Mockingbird Cir
- 2942 Mockingbird Cir
- 2918 Mockingbird Cir