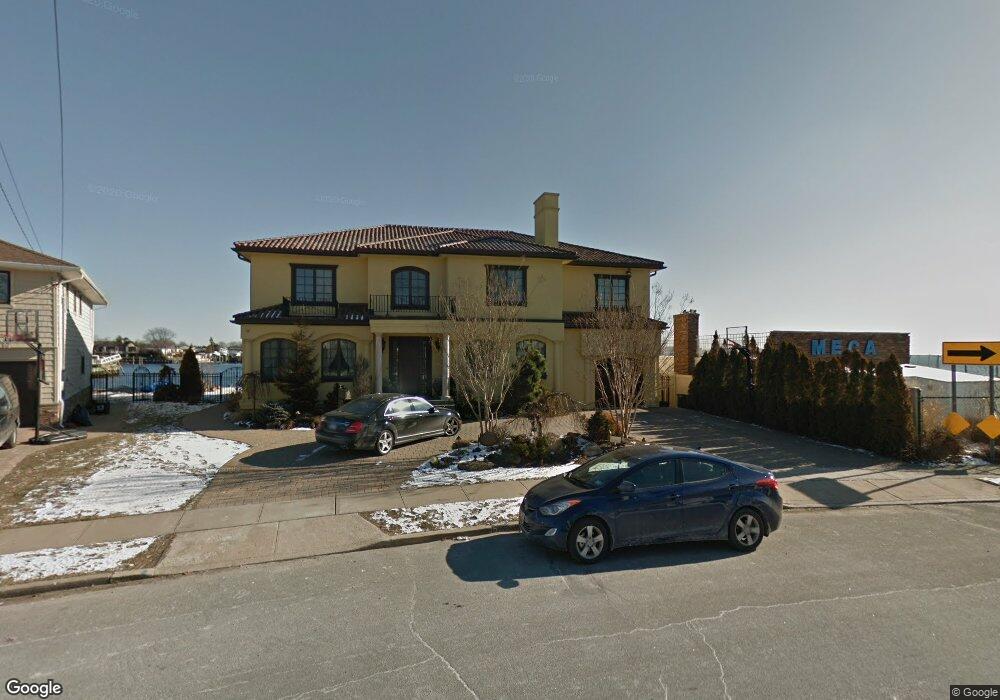
2929 Shore Dr Merrick, NY 11566
Estimated Value: $2,203,000 - $2,448,698
4
Beds
7
Baths
4,977
Sq Ft
$467/Sq Ft
Est. Value
About This Home
This home is located at 2929 Shore Dr, Merrick, NY 11566 and is currently estimated at $2,325,849, approximately $467 per square foot. 2929 Shore Dr is a home located in Nassau County with nearby schools including Merrick Avenue Middle School, John F. Kennedy High School, and Grace Christian Academy.
Ownership History
Date
Name
Owned For
Owner Type
Purchase Details
Closed on
Dec 27, 2023
Sold by
Laganas Eliza
Bought by
2929 Shore Drive Llc
Current Estimated Value
Purchase Details
Closed on
Oct 20, 2009
Sold by
Laganas Steven and Laganas Eliza
Bought by
Laganas Eliza
Purchase Details
Closed on
Jul 10, 2003
Sold by
Stahl Stanley
Purchase Details
Closed on
Nov 8, 1996
Create a Home Valuation Report for This Property
The Home Valuation Report is an in-depth analysis detailing your home's value as well as a comparison with similar homes in the area
Home Values in the Area
Average Home Value in this Area
Purchase History
| Date | Buyer | Sale Price | Title Company |
|---|---|---|---|
| 2929 Shore Drive Llc | -- | Vision Abstract | |
| 2929 Shore Drive Llc | -- | Vision Abstract | |
| Laganas Eliza | -- | -- | |
| Laganas Eliza | -- | -- | |
| Laganas Eliza | -- | -- | |
| -- | $825,000 | -- | |
| -- | -- | -- | |
| -- | -- | -- | |
| -- | -- | -- | |
| -- | -- | -- |
Source: Public Records
Tax History
| Year | Tax Paid | Tax Assessment Tax Assessment Total Assessment is a certain percentage of the fair market value that is determined by local assessors to be the total taxable value of land and additions on the property. | Land | Improvement |
|---|---|---|---|---|
| 2025 | $39,340 | $1,296 | $348 | $948 |
| 2024 | $8,645 | $1,345 | $362 | $983 |
Source: Public Records
Map
Nearby Homes
- 1993 Lowell Ln
- 1981 Cynthia Ln
- 2863 Harbor Rd
- 2884 Bay Dr
- 1864 Cynthia Ln
- 1841 Stanley Dr
- 2994 Lonni Ln
- 2970 Bond Dr
- 2988 Bond Dr
- 1827 Glenn Ln
- 3034 Bond Dr
- 2066 Holland Way
- 2845 Whaleneck Dr
- 2074 Ellen Dr
- 2729 Shore Dr
- 2070 Beverly Way
- 1903 George Ct
- 3106 Clubhouse Rd
- 2072 Brighton Way
- 2688 Rosebud Ave
Your Personal Tour Guide
Ask me questions while you tour the home.