293 Blue Grouse Cir Westcliffe, CO 81252
Estimated Value: $983,000 - $1,340,953
3
Beds
4
Baths
2,237
Sq Ft
$498/Sq Ft
Est. Value
About This Home
This home is located at 293 Blue Grouse Cir, Westcliffe, CO 81252 and is currently estimated at $1,114,651, approximately $498 per square foot. 293 Blue Grouse Cir is a home located in Custer County with nearby schools including Custer County Elementary School, Custer Middle School, and Custer County High School.
Ownership History
Date
Name
Owned For
Owner Type
Purchase Details
Closed on
May 20, 2024
Sold by
Thomas C Fulton C and Thomas Sandra L
Bought by
Fulton Thomas Carl
Current Estimated Value
Purchase Details
Closed on
Dec 17, 2018
Sold by
Fulton Thomas C and Perkins Sandra L
Bought by
The Thomas C Fulton And Sandra L Perkins
Purchase Details
Closed on
May 23, 2007
Sold by
Fulton Thomas Carl and Perkins Shandra L
Bought by
Fulton Thomas C and Perkins Sandra L
Purchase Details
Closed on
May 26, 1999
Sold by
Robbins Stephen A and Robbins Karin B
Bought by
Fulton Thomas C and Perkins Sandra L
Purchase Details
Closed on
Mar 8, 1994
Sold by
Guidry Loyd and Guidry Ellen
Bought by
Robbins Stephen and Robbins Karin
Purchase Details
Closed on
Jun 21, 1993
Sold by
Prak Job Luning
Bought by
Perkins Sandra and Fulton Thomas
Purchase Details
Closed on
Dec 8, 1992
Sold by
Custer Development
Bought by
Prak Job Luning
Create a Home Valuation Report for This Property
The Home Valuation Report is an in-depth analysis detailing your home's value as well as a comparison with similar homes in the area
Home Values in the Area
Average Home Value in this Area
Purchase History
| Date | Buyer | Sale Price | Title Company |
|---|---|---|---|
| Fulton Thomas Carl | -- | None Listed On Document | |
| The Thomas C Fulton And Sandra L Perkins | -- | None Available | |
| Fulton Thomas C | -- | -- | |
| Fulton Thomas C | $69,000 | -- | |
| Robbins Stephen | $58,000 | -- | |
| Perkins Sandra | $53,900 | -- | |
| Prak Job Luning | -- | -- |
Source: Public Records
Tax History Compared to Growth
Tax History
| Year | Tax Paid | Tax Assessment Tax Assessment Total Assessment is a certain percentage of the fair market value that is determined by local assessors to be the total taxable value of land and additions on the property. | Land | Improvement |
|---|---|---|---|---|
| 2024 | $3,702 | $62,440 | $0 | $0 |
| 2023 | $3,702 | $62,440 | $0 | $0 |
| 2022 | $3,214 | $49,870 | $23,380 | $26,490 |
| 2021 | $2,823 | $49,870 | $23,380 | $26,490 |
| 2020 | $2,297 | $42,330 | $18,460 | $23,870 |
| 2019 | $2,285 | $42,330 | $18,460 | $23,870 |
| 2018 | $2,095 | $39,280 | $18,590 | $20,690 |
| 2017 | $2,031 | $39,266 | $18,585 | $20,681 |
| 2016 | $2,397 | $39,380 | $17,120 | $22,260 |
| 2015 | -- | $494,698 | $215,100 | $279,598 |
| 2012 | $2,361 | $500,152 | $215,100 | $285,052 |
Source: Public Records
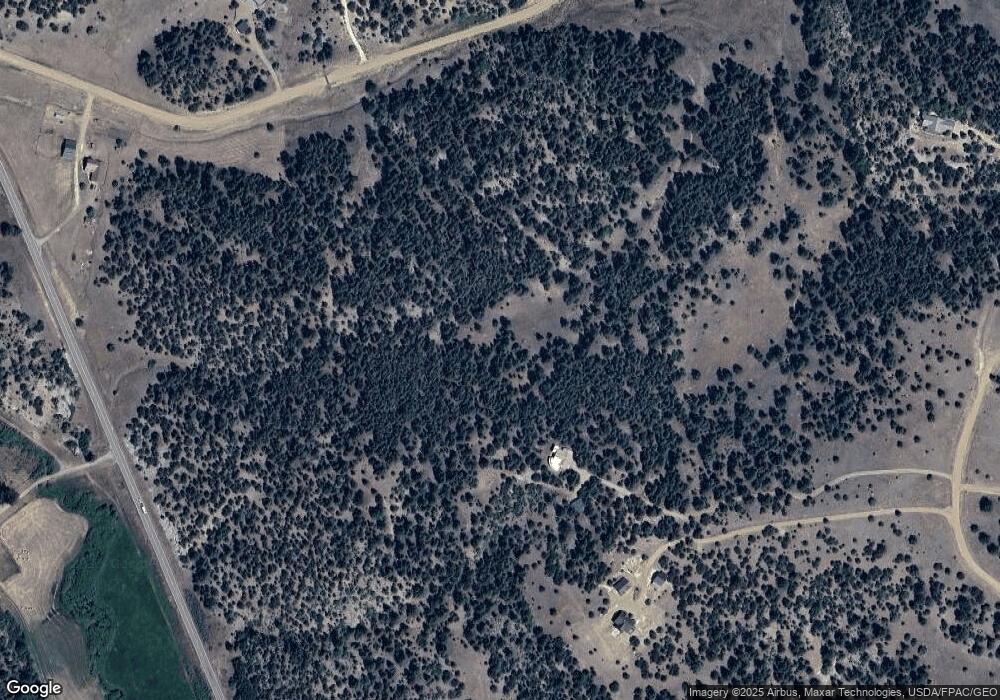
Map
Nearby Homes
- 68600 Colorado 69
- 68600 State Highway 69
- 278 Blue Grouse Cir
- 188 Looters Ln
- 67445 State Highway 69
- 209 Rosewood Rd
- 1491 Oak Dr
- 325 Mcmurtrie Rd
- 1601 Desperado Dr
- 1601 Desperado Dr Unit 12
- 249 Hagerman Rd
- 1328 Round up Rd
- TBD Palmer Rd
- 188 Looters Ln
- 781 Ridgeway Rd
- 2850 County Road 191
- 1301 Pheasant Loop
- 148 Mears Rd
- 0 Corral N Unit REC4003395
- 0 Corral N Unit 5584754
- 245 Blue Grouse Cir
- 333 Blue Grouse Dr
- 357 Blue Grouse Cir
- 68600 State Highway 69
- 378 Blue Grouse Cir
- 235 County Rd 203
- TBD Blue Grouse Cir
- 300 Wild Turkey Rd Unit 6
- 300 Wild Turkey Rd
- 67725 State Highway 69
- 67725 Hwy 69
- 67725 State Highway 69
- 143 Beaver Ave Unit 19
- 537 Wild Turkey Rd
- 610 Wild Turkey Rd
- 0 Colorado 69 Unit 6084032
- 0 Colorado 69 Unit 9150306
- 0 Colorado 69
- 800 Oak Dr
- 800 Oak Dr