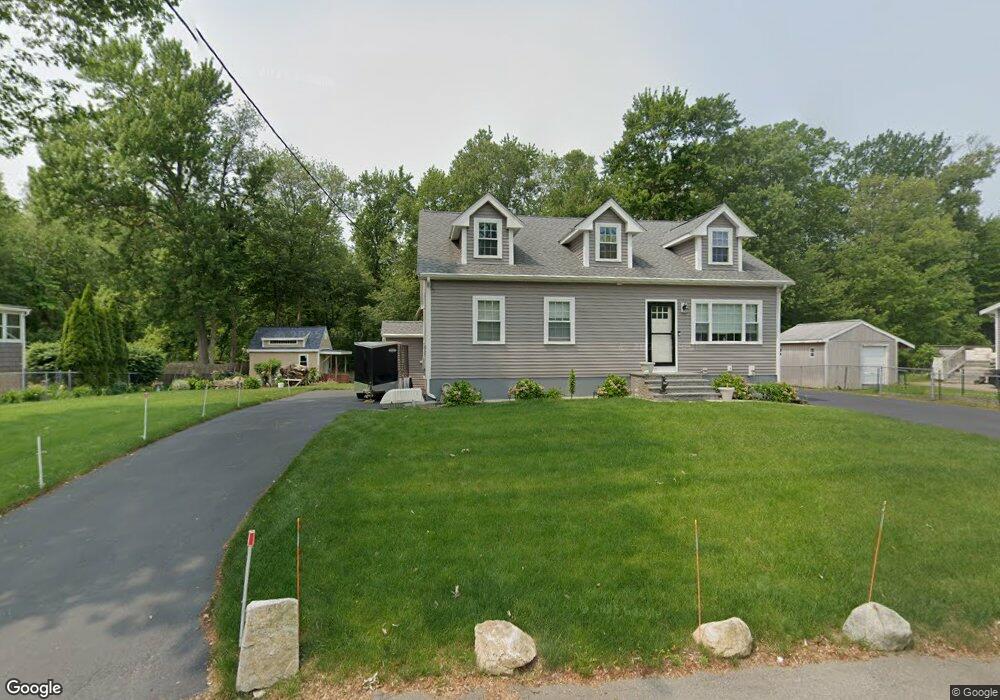
293 Cambo St Brockton, MA 02301
Clifton Heights NeighborhoodEstimated Value: $548,056 - $639,000
3
Beds
1
Bath
836
Sq Ft
$713/Sq Ft
Est. Value
About This Home
This home is located at 293 Cambo St, Brockton, MA 02301 and is currently estimated at $595,764, approximately $712 per square foot. 293 Cambo St is a home located in Plymouth County with nearby schools including Gilmore Elementary School, John F. Kennedy Elementary School, and Davis K-8 School.
Ownership History
Date
Name
Owned For
Owner Type
Purchase Details
Closed on
Sep 12, 2025
Sold by
Barros David A
Bought by
Angelo Rt and Barros
Current Estimated Value
Purchase Details
Closed on
Feb 7, 2007
Sold by
Hall Robert S
Bought by
Hall Tammy L
Purchase Details
Closed on
Sep 29, 1999
Sold by
Munroe Arnold R and Munroe Marie E
Bought by
Hall Robert S
Home Financials for this Owner
Home Financials are based on the most recent Mortgage that was taken out on this home.
Original Mortgage
$142,405
Interest Rate
7.85%
Mortgage Type
Purchase Money Mortgage
Create a Home Valuation Report for This Property
The Home Valuation Report is an in-depth analysis detailing your home's value as well as a comparison with similar homes in the area
Home Values in the Area
Average Home Value in this Area
Purchase History
| Date | Buyer | Sale Price | Title Company |
|---|---|---|---|
| Angelo Rt | -- | -- | |
| Hall Tammy L | -- | -- | |
| Hall Tammy L | -- | -- | |
| Hall Robert S | $149,900 | -- |
Source: Public Records
Mortgage History
| Date | Status | Borrower | Loan Amount |
|---|---|---|---|
| Previous Owner | Hall Robert S | $140,000 | |
| Previous Owner | Hall Robert S | $142,405 |
Source: Public Records
Tax History Compared to Growth
Tax History
| Year | Tax Paid | Tax Assessment Tax Assessment Total Assessment is a certain percentage of the fair market value that is determined by local assessors to be the total taxable value of land and additions on the property. | Land | Improvement |
|---|---|---|---|---|
| 2025 | $5,904 | $487,500 | $149,000 | $338,500 |
| 2024 | $5,814 | $483,700 | $149,000 | $334,700 |
| 2023 | $5,693 | $438,600 | $114,300 | $324,300 |
| 2022 | $5,395 | $386,200 | $104,000 | $282,200 |
| 2021 | $5,153 | $355,400 | $97,500 | $257,900 |
| 2020 | $3,797 | $250,600 | $93,400 | $157,200 |
| 2019 | $3,891 | $250,400 | $87,600 | $162,800 |
| 2018 | $2,980 | $211,400 | $87,600 | $123,800 |
| 2017 | $2,980 | $185,100 | $87,600 | $97,500 |
| 2016 | $3,007 | $173,200 | $83,700 | $89,500 |
| 2015 | $2,911 | $160,400 | $83,700 | $76,700 |
| 2014 | $2,714 | $149,700 | $83,700 | $66,000 |
Source: Public Records
Map
Nearby Homes