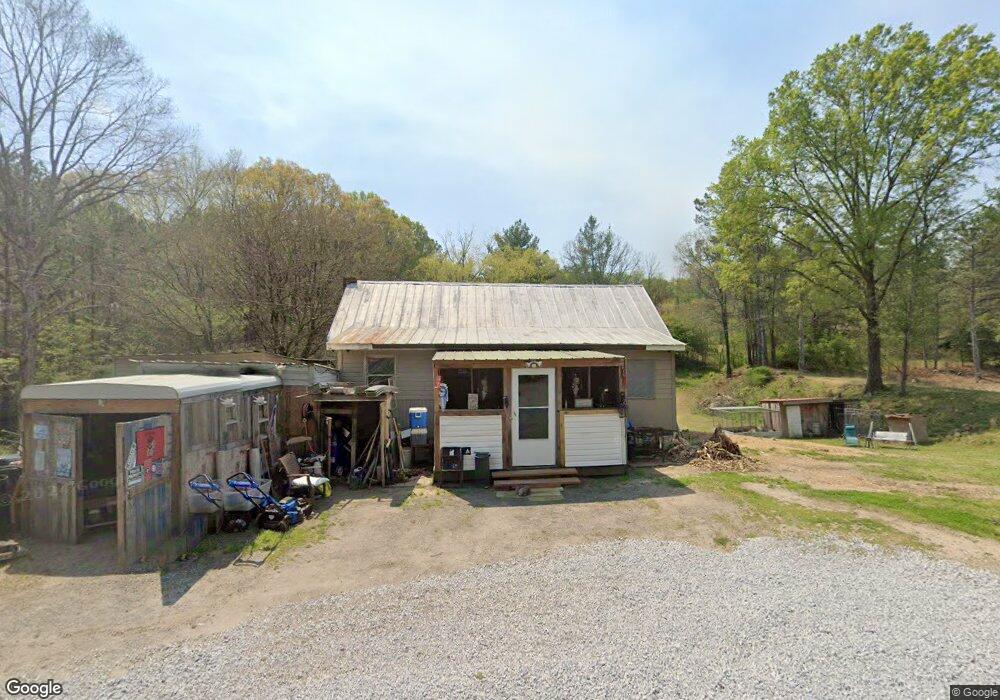
293 Cashtown Loop Rd Aragon, GA 30104
Estimated Value: $112,633 - $158,000
2
Beds
1
Bath
1,240
Sq Ft
$110/Sq Ft
Est. Value
About This Home
This home is located at 293 Cashtown Loop Rd, Aragon, GA 30104 and is currently estimated at $136,908, approximately $110 per square foot. 293 Cashtown Loop Rd is a home located in Polk County with nearby schools including Rockmart Middle School.
Ownership History
Date
Name
Owned For
Owner Type
Purchase Details
Closed on
Aug 20, 2019
Sold by
Tilley Phillip R
Bought by
Rock Valley Family Trust
Current Estimated Value
Purchase Details
Closed on
Mar 23, 2012
Sold by
Miller Roy T
Bought by
Tilley Phillip
Purchase Details
Closed on
Nov 11, 2003
Sold by
Tilley Phillip
Bought by
Miller Roy T
Purchase Details
Closed on
Nov 19, 2002
Sold by
Ernest Eugene Bishop
Bought by
Phillip Tilley
Purchase Details
Closed on
Jun 25, 1997
Sold by
Williams Robert Steven Executor
Bought by
Bishop Ernest Eugene
Purchase Details
Closed on
Jun 11, 1997
Sold by
Williams Lela Mae
Bought by
Williams Robert Steven Executor
Purchase Details
Closed on
May 1, 1991
Sold by
Williams Lyra and Williams
Bought by
Williams Lela Mae
Purchase Details
Closed on
Dec 23, 1969
Sold by
Williams Lela Mae
Bought by
Williams Lela Mae
Purchase Details
Closed on
Aug 10, 1968
Sold by
Robinson Jim and Robinson Annie
Bought by
Williams Lela Mae
Purchase Details
Closed on
Jan 1, 1901
Bought by
Robinson Jim and Robinson Annie
Create a Home Valuation Report for This Property
The Home Valuation Report is an in-depth analysis detailing your home's value as well as a comparison with similar homes in the area
Home Values in the Area
Average Home Value in this Area
Purchase History
| Date | Buyer | Sale Price | Title Company |
|---|---|---|---|
| Rock Valley Family Trust | -- | -- | |
| Tilley Phillip | $35,000 | -- | |
| Miller Roy T | $35,000 | -- | |
| Phillip Tilley | $26,000 | -- | |
| Bishop Ernest Eugene | $10,500 | -- | |
| Williams Robert Steven Executor | -- | -- | |
| Williams Lela Mae | -- | -- | |
| Williams Lela Mae | -- | -- | |
| Williams Lela Mae | -- | -- | |
| Robinson Jim | -- | -- |
Source: Public Records
Tax History Compared to Growth
Tax History
| Year | Tax Paid | Tax Assessment Tax Assessment Total Assessment is a certain percentage of the fair market value that is determined by local assessors to be the total taxable value of land and additions on the property. | Land | Improvement |
|---|---|---|---|---|
| 2024 | $368 | $17,591 | $1,479 | $16,112 |
| 2023 | $287 | $12,090 | $1,479 | $10,611 |
| 2022 | $243 | $10,224 | $986 | $9,238 |
| 2021 | $246 | $10,224 | $986 | $9,238 |
| 2020 | $246 | $10,224 | $986 | $9,238 |
| 2019 | $265 | $9,883 | $986 | $8,897 |
| 2018 | $264 | $9,589 | $986 | $8,603 |
| 2017 | $261 | $9,589 | $986 | $8,603 |
| 2016 | $258 | $9,463 | $860 | $8,603 |
| 2015 | $283 | $10,363 | $860 | $9,503 |
| 2014 | $285 | $10,363 | $860 | $9,503 |
Source: Public Records
Map
Nearby Homes
- 203 Roper Rd
- 203 Roper Rd
- 19 Hudson Loop Rd
- 0 Hudson Loop Unit 7119716
- 347 Cashtown Loop Rd
- 347 Cashtown Loop Rd
- 347 Cashtown Loop Rd
- 10 Hudson Loop Rd
- 10 Hudson Loop Rd
- 357 Cashtown Loop Rd
- 78 Hudson Loop Rd
- 78 Hudson Loop Rd
- 370 Cashtown Loop Rd
- 87 Hudson Loop Rd
- 379 Cashtown Loop Rd
- 189 Cashtown Rd
- 98 Hudson Loop Rd
- 266 Hudson Loop Rd
- 187 Cashtown Rd
- 125 Roper Rd