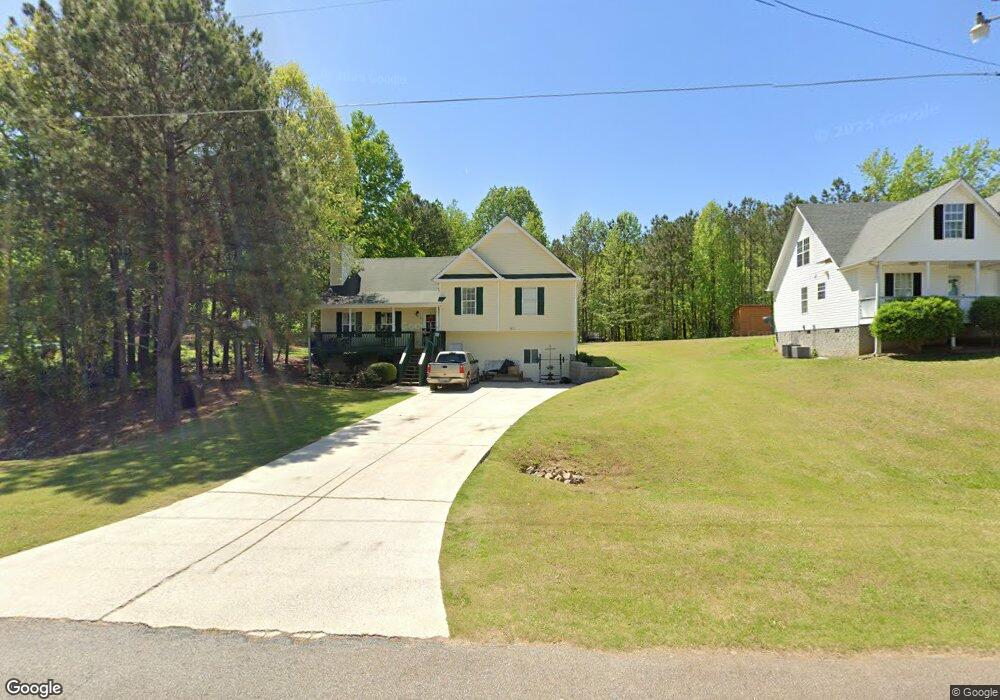
293 Diamond Ct Carrollton, GA 30116
Estimated Value: $243,995 - $283,000
3
Beds
2
Baths
1,347
Sq Ft
$195/Sq Ft
Est. Value
About This Home
This home is located at 293 Diamond Ct, Carrollton, GA 30116 and is currently estimated at $263,249, approximately $195 per square foot. 293 Diamond Ct is a home located in Carroll County with nearby schools including Sand Hill Elementary School, Bay Springs Middle School, and Villa Rica High School.
Ownership History
Date
Name
Owned For
Owner Type
Purchase Details
Closed on
Oct 15, 2009
Sold by
Securetary Of Housing
Bought by
Dorantes Juan Carlos Martinez
Current Estimated Value
Purchase Details
Closed on
Jan 6, 2009
Sold by
Taylor Bean and Whitaker Mortgag
Bought by
Secretary Of Hud
Purchase Details
Closed on
Jun 12, 2006
Sold by
Pitts Garry
Bought by
Pitts Garry
Home Financials for this Owner
Home Financials are based on the most recent Mortgage that was taken out on this home.
Original Mortgage
$102,667
Interest Rate
6.49%
Mortgage Type
New Conventional
Purchase Details
Closed on
Nov 1, 2005
Sold by
Pate Ruby D
Bought by
Jp Morgan Chase Bank Trustee
Purchase Details
Closed on
Nov 5, 2004
Sold by
Crystal Creek Enterp
Bought by
Pate Ruby D
Purchase Details
Closed on
May 27, 1999
Sold by
Webb Jean
Bought by
Crystal Creek Enterp
Purchase Details
Closed on
Sep 10, 1998
Bought by
Webb Jean
Create a Home Valuation Report for This Property
The Home Valuation Report is an in-depth analysis detailing your home's value as well as a comparison with similar homes in the area
Home Values in the Area
Average Home Value in this Area
Purchase History
| Date | Buyer | Sale Price | Title Company |
|---|---|---|---|
| Dorantes Juan Carlos Martinez | $60,000 | -- | |
| Secretary Of Hud | $108,400 | -- | |
| Pitts Garry | $103,500 | -- | |
| Pitts Garry | $103,500 | -- | |
| Jp Morgan Chase Bank Trustee | $86,779 | -- | |
| Pate Ruby D | $103,000 | -- | |
| Pate Ruby D | $103,000 | -- | |
| Crystal Creek Enterp | $258,500 | -- | |
| Webb Jean | -- | -- |
Source: Public Records
Mortgage History
| Date | Status | Borrower | Loan Amount |
|---|---|---|---|
| Previous Owner | Pitts Garry | $102,667 |
Source: Public Records
Tax History Compared to Growth
Tax History
| Year | Tax Paid | Tax Assessment Tax Assessment Total Assessment is a certain percentage of the fair market value that is determined by local assessors to be the total taxable value of land and additions on the property. | Land | Improvement |
|---|---|---|---|---|
| 2024 | $2,272 | $100,430 | $8,000 | $92,430 |
| 2023 | $2,272 | $92,518 | $8,000 | $84,518 |
| 2022 | $1,666 | $66,434 | $7,200 | $59,234 |
| 2021 | $1,486 | $57,954 | $7,200 | $50,754 |
| 2020 | $1,348 | $52,534 | $7,200 | $45,334 |
| 2019 | $1,266 | $48,938 | $7,200 | $41,738 |
| 2018 | $1,144 | $43,574 | $7,200 | $36,374 |
| 2017 | $1,009 | $38,304 | $4,000 | $34,304 |
| 2016 | $1,009 | $38,304 | $4,000 | $34,304 |
| 2015 | $808 | $28,912 | $4,000 | $24,912 |
| 2014 | $734 | $26,144 | $4,000 | $22,144 |
Source: Public Records
Map
Nearby Homes
- 227 Diamond Ct
- 185 Diamond Ct
- 100 Cross Plains Hulett Rd
- 0 Georgia 166 Unit 23176369
- 0 Woodruff Rd Unit 10584605
- 105 Red Oak Dr
- 615 Woodruff Rd
- 128 Jasmine Way
- 135 Jasmine Way
- 2074 Ayers Creek Ct
- 2058 Sewanee Ct
- 1117 Cross Plains Hulett Rd
- 2114 Lakeview Pkwy
- 111 Ayers Driver Rd
- 2513 N Carroll Ct
- 2025 Lakeview Pkwy
- 2219 Harper Dr
- 137 Fawn Dr
- 287 Diamond Ct
- 287 Diamond Ct Unit 18
- 299 Diamond Ct
- 292 Diamond Ct
- 298 Diamond Ct
- 281 Diamond Ct
- 286 Diamond Ct
- 305 Diamond Ct
- 304 Diamond Ct
- 282 Diamond Ct
- 275 Diamond Ct
- 311 Diamond Ct
- 310 Diamond Ct
- 269 Diamond Ct
- 314 Diamond Ct
- 276 Diamond Ct
- 317 Diamond Ct
- 320 Diamond Ct
- 320 Diamond Ct
- 263 Diamond Ct