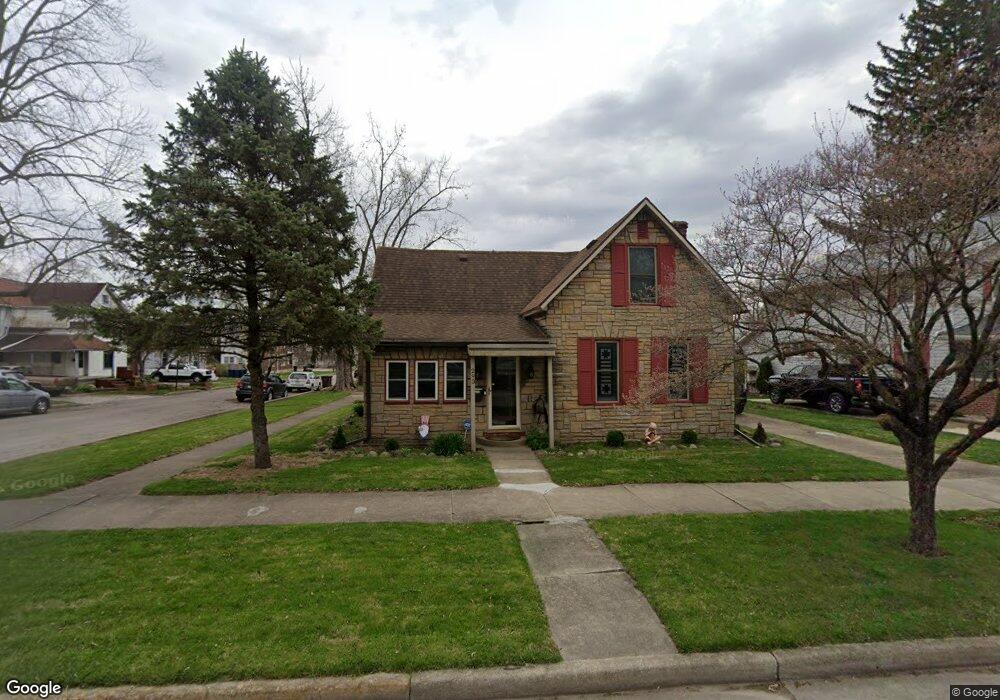
293 E Hill St Wabash, IN 46992
Estimated Value: $122,000 - $169,000
3
Beds
2
Baths
1,834
Sq Ft
$78/Sq Ft
Est. Value
About This Home
This home is located at 293 E Hill St, Wabash, IN 46992 and is currently estimated at $142,347, approximately $77 per square foot. 293 E Hill St is a home located in Wabash County with nearby schools including O.J. Neighbours Elementary School, W C Mills Elementary School, and Wabash Middle School.
Ownership History
Date
Name
Owned For
Owner Type
Purchase Details
Closed on
Aug 21, 2008
Sold by
Lundquist Robert J and Lundquist Kristi D
Bought by
Burger Steve R and Osborne Elbert H
Current Estimated Value
Home Financials for this Owner
Home Financials are based on the most recent Mortgage that was taken out on this home.
Original Mortgage
$54,150
Outstanding Balance
$35,087
Interest Rate
6.5%
Mortgage Type
Adjustable Rate Mortgage/ARM
Estimated Equity
$107,260
Purchase Details
Closed on
Jun 3, 2008
Sold by
Coon Mark H and Coon Julie D
Bought by
Lundquist Robert J and Lundquist Kristi D
Create a Home Valuation Report for This Property
The Home Valuation Report is an in-depth analysis detailing your home's value as well as a comparison with similar homes in the area
Home Values in the Area
Average Home Value in this Area
Purchase History
| Date | Buyer | Sale Price | Title Company |
|---|---|---|---|
| Burger Steve R | -- | -- | |
| Lundquist Robert J | -- | -- |
Source: Public Records
Mortgage History
| Date | Status | Borrower | Loan Amount |
|---|---|---|---|
| Open | Burger Steve R | $54,150 |
Source: Public Records
Tax History
| Year | Tax Paid | Tax Assessment Tax Assessment Total Assessment is a certain percentage of the fair market value that is determined by local assessors to be the total taxable value of land and additions on the property. | Land | Improvement |
|---|---|---|---|---|
| 2025 | $1,016 | $127,700 | $9,200 | $118,500 |
| 2024 | $1,016 | $101,600 | $9,200 | $92,400 |
| 2023 | $893 | $99,300 | $9,200 | $90,100 |
| 2022 | $868 | $89,500 | $7,900 | $81,600 |
| 2021 | $571 | $76,600 | $7,900 | $68,700 |
| 2020 | $500 | $71,000 | $7,900 | $63,100 |
| 2019 | $394 | $66,500 | $7,900 | $58,600 |
| 2018 | $387 | $65,400 | $7,900 | $57,500 |
| 2017 | $413 | $64,600 | $7,900 | $56,700 |
| 2016 | $267 | $64,900 | $7,900 | $57,000 |
| 2014 | $198 | $60,200 | $7,900 | $52,300 |
| 2013 | $157 | $59,000 | $7,900 | $51,100 |
Source: Public Records
Map
Nearby Homes
- 218 E Main St
- 196 E Main St
- 459 E Hill St
- 190 E Canal St
- 35 E Sinclair St
- 343 N East St
- 76 W Canal St
- 409 Congress St
- 681 Washington St
- 290 W Maple St
- 510 N Miami St
- 432 Ferry St
- 495 Manchester Ave
- 218 Columbus St
- 495 Stitt St
- 472 Vermont St
- 1108 N Miami St
- 93 E Sheridan Dr
- 654 High St
- 8 Creekside Ln
Your Personal Tour Guide
Ask me questions while you tour the home.