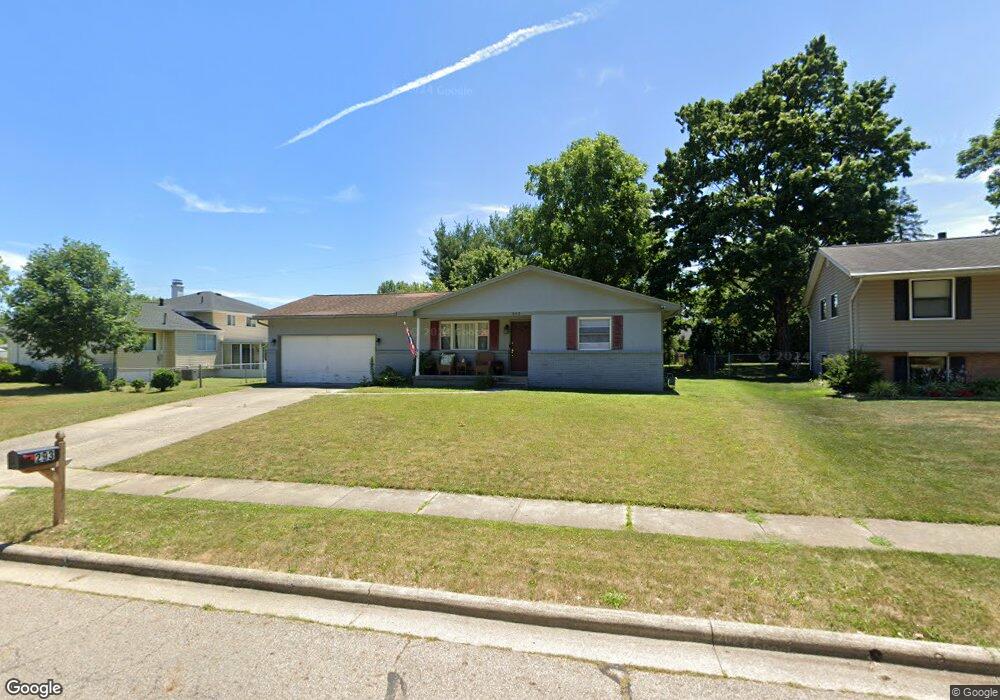
293 Hermitage Rd Columbus, OH 43230
Gahanna-Havens Corners NeighborhoodEstimated Value: $282,000 - $370,000
3
Beds
2
Baths
1,526
Sq Ft
$213/Sq Ft
Est. Value
About This Home
This home is located at 293 Hermitage Rd, Columbus, OH 43230 and is currently estimated at $325,645, approximately $213 per square foot. 293 Hermitage Rd is a home located in Franklin County with nearby schools including Goshen Lane Elementary School, Gahanna West Middle School, and Lincoln High School.
Ownership History
Date
Name
Owned For
Owner Type
Purchase Details
Closed on
Apr 6, 2020
Sold by
Michaelangelo Builders Llc
Bought by
Greenhouse Karen D
Current Estimated Value
Purchase Details
Closed on
Oct 30, 2015
Sold by
Greenhouse Tom and Greenhouse Karen D Greenhouse
Bought by
Michelangelo Builders Llc
Purchase Details
Closed on
Jul 14, 2010
Sold by
Fannie Mae
Bought by
Greenhouse Tom
Purchase Details
Closed on
Apr 8, 2010
Sold by
Reynolds Charles W and Reynolds Pamela J
Bought by
Federal National Mortgage Association
Purchase Details
Closed on
Jul 17, 1989
Bought by
Reynolds Charles W
Purchase Details
Closed on
Jul 1, 1979
Create a Home Valuation Report for This Property
The Home Valuation Report is an in-depth analysis detailing your home's value as well as a comparison with similar homes in the area
Home Values in the Area
Average Home Value in this Area
Purchase History
| Date | Buyer | Sale Price | Title Company |
|---|---|---|---|
| Greenhouse Karen D | -- | None Available | |
| Michelangelo Builders Llc | -- | Attorney | |
| Greenhouse Tom | $96,000 | Accutitle Agency Inc | |
| Federal National Mortgage Association | $104,000 | None Available | |
| Reynolds Charles W | $81,900 | -- | |
| -- | $56,900 | -- |
Source: Public Records
Tax History Compared to Growth
Tax History
| Year | Tax Paid | Tax Assessment Tax Assessment Total Assessment is a certain percentage of the fair market value that is determined by local assessors to be the total taxable value of land and additions on the property. | Land | Improvement |
|---|---|---|---|---|
| 2024 | $5,886 | $97,930 | $33,460 | $64,470 |
| 2023 | $5,813 | $97,930 | $33,460 | $64,470 |
| 2022 | $5,031 | $66,010 | $16,520 | $49,490 |
| 2021 | $4,869 | $66,010 | $16,520 | $49,490 |
| 2020 | $4,830 | $66,010 | $16,520 | $49,490 |
| 2019 | $4,032 | $54,810 | $13,790 | $41,020 |
| 2018 | $3,700 | $54,810 | $13,790 | $41,020 |
| 2017 | $3,552 | $54,810 | $13,790 | $41,020 |
| 2016 | $3,393 | $45,650 | $13,480 | $32,170 |
| 2015 | $3,396 | $45,650 | $13,480 | $32,170 |
| 2014 | $3,370 | $45,650 | $13,480 | $32,170 |
| 2013 | $1,675 | $45,640 | $13,475 | $32,165 |
Source: Public Records
Map
Nearby Homes
- 300 Dunbarton Rd
- 300 Brookhaven Dr E
- 407 Denison Ave
- 491 Daventry Ln
- 600 Agler Rd
- 183 Serran Dr
- 135 Serran Dr
- 3832 Emmons Ave
- 0 E Emmons Ave
- 148 Sierra Dr
- 321 Flint Ridge Dr
- 0 E Minnesota Ave Unit 224018641
- 3888 Agler Rd
- 2876 Johnstown Rd
- 221 Lincolnshire Rd
- 206 Lintner St
- 3784 Armuth Ave
- 1822 Stelzer Rd
- 388 Elkwood Place
- 2275 Stelzer Rd
- 311 Brookhaven Dr W
- 301 Hermitage Rd
- 282 Dunbarton Rd
- 321 Brookhaven Dr W
- 288 Dunbarton Rd
- 323 Brookhaven Dr W
- 309 Hermitage Rd
- 302 Hermitage Rd
- 296 Hermitage Rd
- 294 Dunbarton Rd
- 306 Brookhaven Dr W
- 310 Hermitage Rd
- 317 Hermitage Rd
- 316 Brookhaven Dr W
- 306 Dunbarton Rd
- 290 Brookhaven Dr W
- 318 Hermitage Rd
- 271 Hermitage Rd
- 279 Dunbarton Rd
- 312 Dunbarton Rd