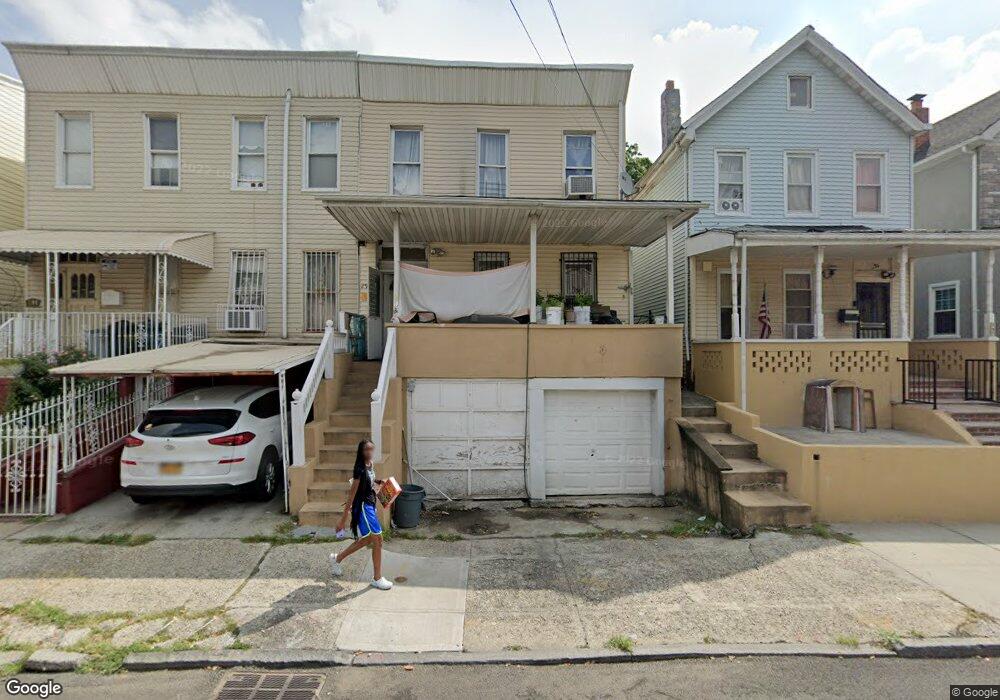
293 Logan St Brooklyn, NY 11208
East New York NeighborhoodEstimated Value: $716,750 - $1,080,000
--
Bed
--
Bath
1,552
Sq Ft
$572/Sq Ft
Est. Value
About This Home
This home is located at 293 Logan St, Brooklyn, NY 11208 and is currently estimated at $887,438, approximately $571 per square foot. 293 Logan St is a home located in Kings County with nearby schools including P.S. 345 Patrolman Robert Bolden, Liberty Avenue Middle School, and Vista Academy.
Ownership History
Date
Name
Owned For
Owner Type
Purchase Details
Closed on
Jan 29, 1997
Sold by
Khan Grace E
Bought by
Rambharose Vickram and Rambharose Kunti
Current Estimated Value
Home Financials for this Owner
Home Financials are based on the most recent Mortgage that was taken out on this home.
Original Mortgage
$125,750
Outstanding Balance
$14,331
Interest Rate
7.65%
Mortgage Type
FHA
Estimated Equity
$873,107
Create a Home Valuation Report for This Property
The Home Valuation Report is an in-depth analysis detailing your home's value as well as a comparison with similar homes in the area
Home Values in the Area
Average Home Value in this Area
Purchase History
| Date | Buyer | Sale Price | Title Company |
|---|---|---|---|
| Rambharose Vickram | $130,000 | First American Title Ins Co |
Source: Public Records
Mortgage History
| Date | Status | Borrower | Loan Amount |
|---|---|---|---|
| Open | Rambharose Vickram | $125,750 |
Source: Public Records
Tax History Compared to Growth
Tax History
| Year | Tax Paid | Tax Assessment Tax Assessment Total Assessment is a certain percentage of the fair market value that is determined by local assessors to be the total taxable value of land and additions on the property. | Land | Improvement |
|---|---|---|---|---|
| 2025 | $4,478 | $50,700 | $10,560 | $40,140 |
| 2024 | $4,478 | $43,800 | $10,560 | $33,240 |
| 2023 | $4,528 | $48,720 | $10,560 | $38,160 |
| 2022 | $4,416 | $46,500 | $10,560 | $35,940 |
| 2021 | $4,392 | $44,640 | $10,560 | $34,080 |
| 2020 | $3,294 | $47,220 | $10,560 | $36,660 |
| 2019 | $3,886 | $48,420 | $10,560 | $37,860 |
| 2018 | $3,787 | $18,578 | $5,551 | $13,027 |
| 2017 | $3,758 | $18,434 | $6,374 | $12,060 |
| 2016 | $3,477 | $17,392 | $6,404 | $10,988 |
| 2015 | $1,878 | $16,410 | $5,396 | $11,014 |
| 2014 | $1,878 | $15,482 | $5,419 | $10,063 |
Source: Public Records
Map
Nearby Homes
- 73 Milford St
- 92 Fountain Ave
- 37 Montauk Ave
- 90 Milford St
- 404 Logan St
- 851 Glenmore Ave
- 19 Doscher St
- 283 Shepherd Ave
- 126 Crystal St
- 852 Glenmore Ave
- 447 Logan St
- 130 Crystal St
- 127 Crystal St
- 184 Milford St
- 203 Essex St
- 370 Crescent St
- 166 Atkins Ave
- 400 Crescent St
- 170 Atkins Ave
- 133 Highland Place
- 297 Logan St
- 291 Logan St
- 289 Logan St
- 299 Logan St
- 287 Logan St
- 287 Logan St Unit 1
- 287 Logan St Unit 2
- 303 Logan St
- 285 Logan St
- 40 Fountain Ave
- 42 Fountain Ave
- 44 Fountain Ave
- 38 Fountain Ave
- 46 Fountain Ave
- 50 Fountain Ave
- 50 Fountain Ave Unit 2
- 52 Fountain Ave
- 309 Logan St
- 32 Fountain Ave
- 32 Fountain Ave