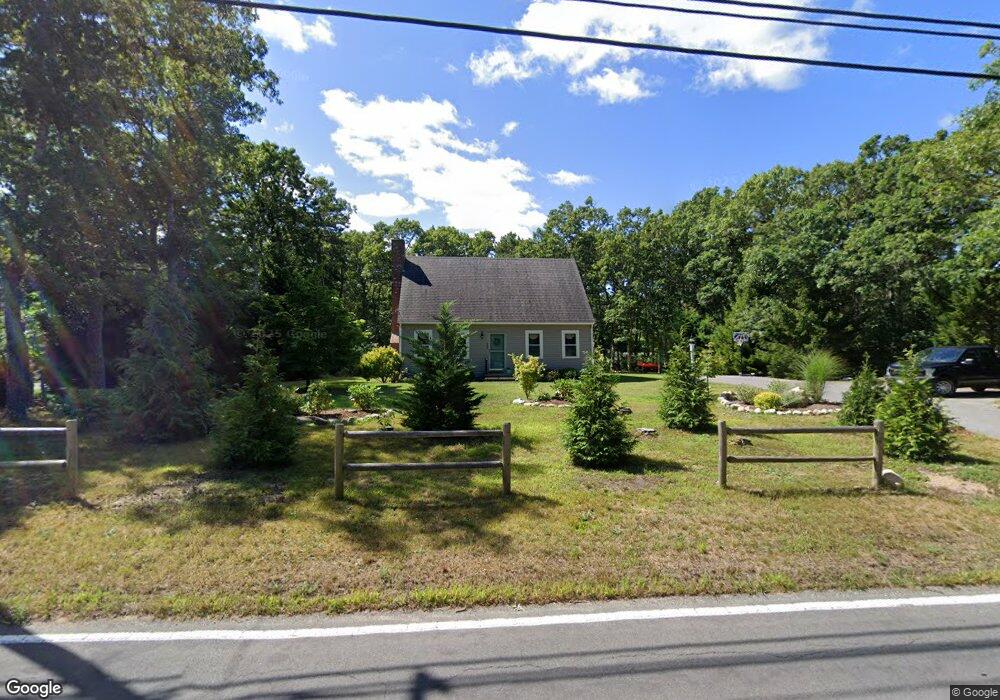
293 Main St Harwich, MA 02645
Northwest Harwich NeighborhoodEstimated Value: $661,000 - $820,000
2
Beds
2
Baths
1,547
Sq Ft
$463/Sq Ft
Est. Value
About This Home
This home is located at 293 Main St, Harwich, MA 02645 and is currently estimated at $716,820, approximately $463 per square foot. 293 Main St is a home located in Barnstable County with nearby schools including Harwich Elementary School, Chatham Elementary School, and Monomoy Regional Middle School.
Ownership History
Date
Name
Owned For
Owner Type
Purchase Details
Closed on
Feb 28, 1997
Sold by
Main St Nt and Ferioli Ronald J
Bought by
Hall Richard T and Hall Sally J
Current Estimated Value
Home Financials for this Owner
Home Financials are based on the most recent Mortgage that was taken out on this home.
Original Mortgage
$90,000
Interest Rate
7.78%
Mortgage Type
Purchase Money Mortgage
Create a Home Valuation Report for This Property
The Home Valuation Report is an in-depth analysis detailing your home's value as well as a comparison with similar homes in the area
Home Values in the Area
Average Home Value in this Area
Purchase History
| Date | Buyer | Sale Price | Title Company |
|---|---|---|---|
| Hall Richard T | $39,000 | -- |
Source: Public Records
Mortgage History
| Date | Status | Borrower | Loan Amount |
|---|---|---|---|
| Open | Hall Richard T | $69,000 | |
| Closed | Hall Richard T | $90,000 | |
| Previous Owner | Hall Richard T | $35,000 |
Source: Public Records
Tax History Compared to Growth
Tax History
| Year | Tax Paid | Tax Assessment Tax Assessment Total Assessment is a certain percentage of the fair market value that is determined by local assessors to be the total taxable value of land and additions on the property. | Land | Improvement |
|---|---|---|---|---|
| 2025 | $3,261 | $551,700 | $173,300 | $378,400 |
| 2024 | $3,136 | $520,100 | $163,500 | $356,600 |
| 2023 | $3,024 | $455,400 | $148,700 | $306,700 |
| 2022 | $2,946 | $363,200 | $129,300 | $233,900 |
| 2021 | $2,829 | $328,900 | $117,600 | $211,300 |
| 2020 | $2,836 | $324,800 | $118,600 | $206,200 |
| 2019 | $2,718 | $313,500 | $114,000 | $199,500 |
| 2018 | $2,561 | $282,500 | $91,400 | $191,100 |
| 2017 | $2,312 | $257,800 | $72,200 | $185,600 |
| 2016 | $2,267 | $249,900 | $72,200 | $177,700 |
| 2015 | $2,183 | $243,400 | $70,800 | $172,600 |
| 2014 | $2,090 | $238,300 | $68,700 | $169,600 |
Source: Public Records
Map
Nearby Homes
- 213 S Westgate Rd
- 103 Main Extension St
- 2 Bassett Woods Rd
- 1 Shore Dr
- 537 Depot St
- 98 North Rd
- 12 Old Campground Rd
- 18 Old Campground
- 42 Barn Swallow Ln
- 91 Depot Rd W
- 12 Cranberry Trail
- 418 Depot St
- 64 Smith St
- 13 Six Penny Ln
- 13 6 Penny Ln
- 11 Lane Rd
- 116 Sisson Rd
- 14 Dogwood Ln
- 126 Massachusetts 28
- 264 Massachusetts 28
- 57 Deacons Folly Rd
- 297 Main St
- 53 Deacons Folly Rd
- 303 Main St
- 49 Deacons Folly Rd
- 300 Main St
- 290 Main St
- 306 Main St
- 309 Main St
- 0 Deacon's Folly
- 0 Deacons Folly Rd L: Unit 70554072
- 273 Main St
- 288 Main St
- 41 Deacons Folly Rd
- 317 Main St
- 16 Deacons Folly Rd
- 286 Main St
- 20 Deacons Folly Rd
- 24 Deacons Folly Rd
- 316 Main St