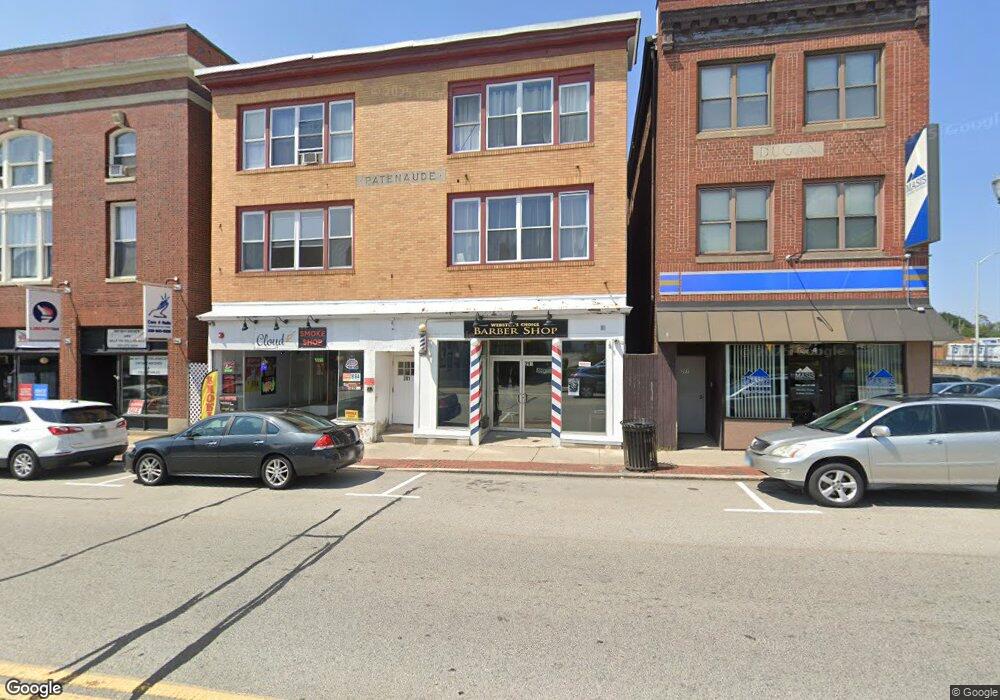
293 Main St Webster, MA 01570
Estimated Value: $1,216,410
15
Beds
15
Baths
9,544
Sq Ft
$127/Sq Ft
Est. Value
About This Home
This home is located at 293 Main St, Webster, MA 01570 and is currently estimated at $1,216,410, approximately $127 per square foot. 293 Main St is a home located in Worcester County with nearby schools including Park Avenue Elementary School, Webster Middle School, and Bartlett High School.
Ownership History
Date
Name
Owned For
Owner Type
Purchase Details
Closed on
Mar 31, 2017
Sold by
293 Main Street Nt
Bought by
Hometown Property Grou
Current Estimated Value
Home Financials for this Owner
Home Financials are based on the most recent Mortgage that was taken out on this home.
Original Mortgage
$600,000
Outstanding Balance
$498,468
Interest Rate
4.15%
Mortgage Type
Commercial
Estimated Equity
$717,942
Purchase Details
Closed on
Feb 29, 2012
Sold by
Tmoj Group Llc
Bought by
293 Main St Nt
Home Financials for this Owner
Home Financials are based on the most recent Mortgage that was taken out on this home.
Original Mortgage
$427,500
Interest Rate
3.88%
Mortgage Type
Commercial
Purchase Details
Closed on
Sep 16, 2005
Sold by
Duca Victor
Bought by
Tmoj Grp Llc
Home Financials for this Owner
Home Financials are based on the most recent Mortgage that was taken out on this home.
Original Mortgage
$425,000
Interest Rate
5.84%
Mortgage Type
Commercial
Purchase Details
Closed on
Jun 6, 2005
Sold by
Tac Prop Inc
Bought by
Webster Red Auth
Purchase Details
Closed on
Sep 14, 1990
Sold by
Webster 5C Sb
Bought by
Tac Properties Inc
Home Financials for this Owner
Home Financials are based on the most recent Mortgage that was taken out on this home.
Original Mortgage
$215,000
Interest Rate
9.76%
Mortgage Type
Commercial
Create a Home Valuation Report for This Property
The Home Valuation Report is an in-depth analysis detailing your home's value as well as a comparison with similar homes in the area
Home Values in the Area
Average Home Value in this Area
Purchase History
| Date | Buyer | Sale Price | Title Company |
|---|---|---|---|
| Hometown Property Grou | $600,000 | -- | |
| 293 Main St Nt | $570,000 | -- | |
| Tmoj Grp Llc | $375,000 | -- | |
| Webster Red Auth | $65,000 | -- | |
| Tac Properties Inc | $165,000 | -- |
Source: Public Records
Mortgage History
| Date | Status | Borrower | Loan Amount |
|---|---|---|---|
| Open | Hometown Property Grou | $600,000 | |
| Previous Owner | 293 Main St Nt | $427,500 | |
| Previous Owner | Tac Properties Inc | $57,000 | |
| Previous Owner | Tmoj Grp Llc | $425,000 | |
| Previous Owner | Tac Properties Inc | $215,000 |
Source: Public Records
Tax History
| Year | Tax Paid | Tax Assessment Tax Assessment Total Assessment is a certain percentage of the fair market value that is determined by local assessors to be the total taxable value of land and additions on the property. | Land | Improvement |
|---|---|---|---|---|
| 2025 | $9,233 | $777,200 | $103,500 | $673,700 |
| 2024 | $9,105 | $747,500 | $99,500 | $648,000 |
| 2023 | $8,690 | $695,200 | $94,800 | $600,400 |
| 2022 | $8,844 | $633,500 | $88,600 | $544,900 |
| 2021 | $8,793 | $582,300 | $80,600 | $501,700 |
| 2020 | $8,550 | $567,700 | $80,600 | $487,100 |
| 2019 | $8,451 | $551,300 | $78,300 | $473,000 |
| 2018 | $0 | $546,700 | $78,300 | $468,400 |
| 2017 | $0 | $515,800 | $76,700 | $439,100 |
| 2016 | -- | $526,800 | $76,700 | $450,100 |
| 2015 | -- | $521,800 | $75,200 | $446,600 |
Source: Public Records
Map
Nearby Homes
- 299 Main St
- 281 Main St
- 273 Main St Unit Telegram
- 273 Main St Unit IA
- 273 Main St Unit IA-ID
- 273 Main St Unit IB
- 273 Main St Unit Charter
- 273 Main St
- 273-283 Main St Unit 203
- 273-283 Main St Unit 205
- 273-283 Main St Unit 304
- 273-283 Main St Unit 207
- 268 Main St Unit 270
- 268 Main St Unit 1
- 253 S Main St
- 268 S Main St
- 0 Maryann Ln Unit 71439285
- 258 Main St Unit 3
- 258 Main St Unit 2
- 260 Main St
Your Personal Tour Guide
Ask me questions while you tour the home.