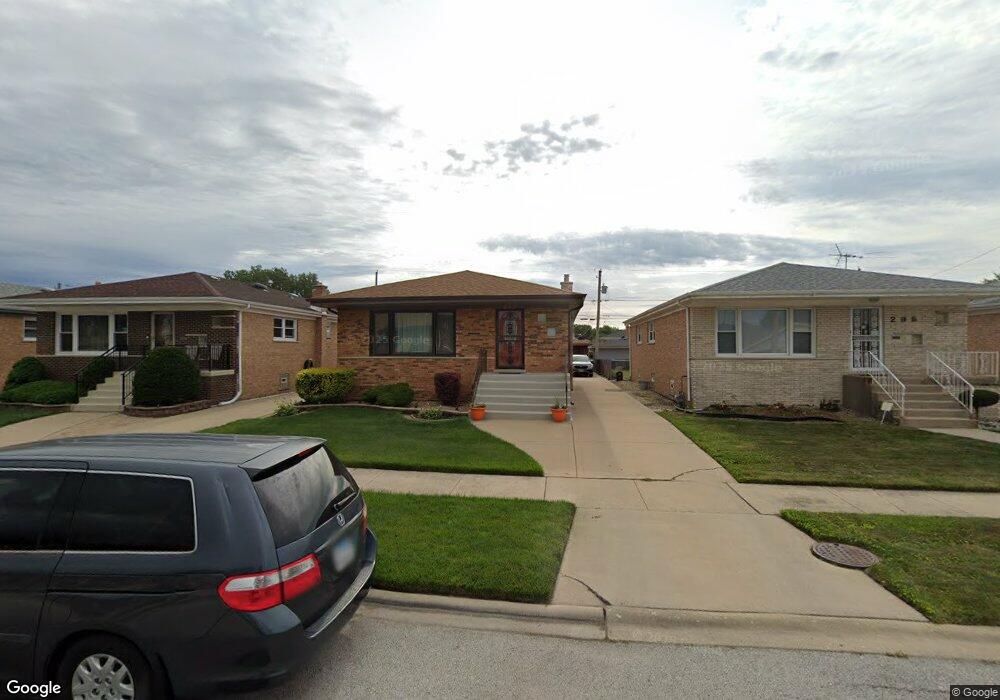
293 Marquette Ave Calumet City, IL 60409
Estimated Value: $203,000 - $279,000
3
Beds
2
Baths
1,313
Sq Ft
$171/Sq Ft
Est. Value
About This Home
This home is located at 293 Marquette Ave, Calumet City, IL 60409 and is currently estimated at $224,491, approximately $170 per square foot. 293 Marquette Ave is a home located in Cook County with nearby schools including Wilson Elementary School, Wentworth Intermediate School, and Wentworth Jr High School.
Ownership History
Date
Name
Owned For
Owner Type
Purchase Details
Closed on
May 1, 2002
Sold by
The Board Of Trustees Of The University
Bought by
South Campus Development Team Llc
Current Estimated Value
Purchase Details
Closed on
Nov 30, 2001
Sold by
Hud
Bought by
Walker Joseph G and Spight Walker Kimberly C
Home Financials for this Owner
Home Financials are based on the most recent Mortgage that was taken out on this home.
Original Mortgage
$57,000
Interest Rate
6.87%
Purchase Details
Closed on
Jun 20, 2001
Sold by
Williams
Bought by
Hud
Purchase Details
Closed on
Apr 27, 1994
Sold by
Ryan Michael E and Ryan Barbara A
Bought by
Williams Cleopher and Williams Carolyn
Home Financials for this Owner
Home Financials are based on the most recent Mortgage that was taken out on this home.
Original Mortgage
$106,900
Interest Rate
7.88%
Mortgage Type
FHA
Create a Home Valuation Report for This Property
The Home Valuation Report is an in-depth analysis detailing your home's value as well as a comparison with similar homes in the area
Home Values in the Area
Average Home Value in this Area
Purchase History
| Date | Buyer | Sale Price | Title Company |
|---|---|---|---|
| South Campus Development Team Llc | -- | -- | |
| Walker Joseph G | -- | Stewart Title | |
| Hud | -- | -- | |
| Williams Cleopher | $107,000 | -- |
Source: Public Records
Mortgage History
| Date | Status | Borrower | Loan Amount |
|---|---|---|---|
| Previous Owner | Walker Joseph G | $57,000 | |
| Previous Owner | Williams Cleopher | $106,900 | |
| Closed | Walker Joseph G | $58,500 | |
| Closed | South Campus Development Team Llc | $0 |
Source: Public Records
Tax History Compared to Growth
Tax History
| Year | Tax Paid | Tax Assessment Tax Assessment Total Assessment is a certain percentage of the fair market value that is determined by local assessors to be the total taxable value of land and additions on the property. | Land | Improvement |
|---|---|---|---|---|
| 2024 | $7,528 | $15,000 | $2,948 | $12,052 |
| 2023 | $4,925 | $15,000 | $2,948 | $12,052 |
| 2022 | $4,925 | $9,531 | $2,546 | $6,985 |
| 2021 | $6,327 | $11,490 | $2,546 | $8,944 |
| 2020 | $6,097 | $11,490 | $2,546 | $8,944 |
| 2019 | $3,633 | $8,184 | $2,144 | $6,040 |
| 2018 | $3,554 | $8,184 | $2,144 | $6,040 |
| 2017 | $3,478 | $8,184 | $2,144 | $6,040 |
| 2016 | $3,971 | $8,492 | $2,010 | $6,482 |
| 2015 | $3,819 | $8,492 | $2,010 | $6,482 |
| 2014 | $4,840 | $9,398 | $2,010 | $7,388 |
| 2013 | $5,014 | $11,289 | $2,010 | $9,279 |
Source: Public Records
Map
Nearby Homes
- 14541 S Marquette Ave
- 289 Saginaw Ave
- 327 Marquette Ave
- 2605 E Martha Place
- 341 Saginaw Ave
- 281 Hoxie Ave
- 1074 George St
- 286 Calhoun Ave
- 412 Saginaw Ave
- 318 Campbell Ave
- 2736 E Goodrich Ave
- 430 Marquette Ave
- 383 Calhoun Ave
- 372 Bensley Ave
- 349 Yates Ave
- 1119 Lucas St
- 353 Yates Ave
- 453 Hoxie Ave
- 14240 S Manistee Ave
- 14322 S Hoxie Ave
- 295 Marquette Ave
- 289 Marquette Ave
- 299 Marquette Ave
- 287 Marquette Ave
- 283 Marquette Ave
- 303 Marquette Ave
- 303 Marquette Ave
- 292 Manistee Ave
- 288 Manistee Ave
- 294 Manistee Ave
- 281 Marquette Ave
- 307 Marquette Ave
- 298 Manistee Ave
- 286 Manistee Ave
- 282 Manistee Ave
- 300 Manistee Ave
- 292 Marquette Ave
- 294 Marquette Ave
- 288 Marquette Ave
- 277 Marquette Ave