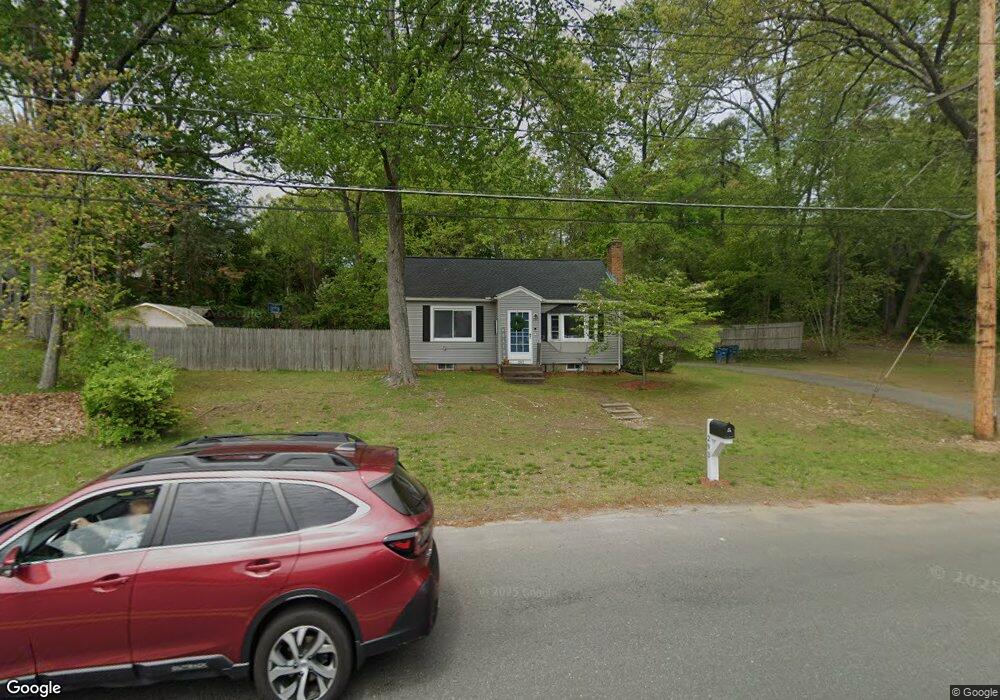
293 Morton St Unit na West Springfield, MA 01089
Estimated Value: $312,000 - $328,551
3
Beds
1
Bath
1,465
Sq Ft
$219/Sq Ft
Est. Value
About This Home
This home is located at 293 Morton St Unit na, West Springfield, MA 01089 and is currently estimated at $320,138, approximately $218 per square foot. 293 Morton St Unit na is a home located in Hampden County with nearby schools including St Thomas The Apostle School.
Ownership History
Date
Name
Owned For
Owner Type
Purchase Details
Closed on
Oct 13, 2011
Sold by
Fnma
Bought by
Mason Robert M
Current Estimated Value
Home Financials for this Owner
Home Financials are based on the most recent Mortgage that was taken out on this home.
Original Mortgage
$130,603
Outstanding Balance
$89,718
Interest Rate
4.25%
Mortgage Type
Purchase Money Mortgage
Estimated Equity
$230,420
Purchase Details
Closed on
Sep 29, 2011
Sold by
Bank Of America Na and Kwartowitz
Bought by
Federal National Mortgage Association
Home Financials for this Owner
Home Financials are based on the most recent Mortgage that was taken out on this home.
Original Mortgage
$130,603
Outstanding Balance
$89,718
Interest Rate
4.25%
Mortgage Type
Purchase Money Mortgage
Estimated Equity
$230,420
Purchase Details
Closed on
May 12, 2006
Sold by
Mckenna Maureen A
Bought by
Kwartowitz Adam L
Home Financials for this Owner
Home Financials are based on the most recent Mortgage that was taken out on this home.
Original Mortgage
$182,875
Interest Rate
6.4%
Mortgage Type
Purchase Money Mortgage
Purchase Details
Closed on
Dec 31, 2004
Sold by
Mckenna Maureen A and Ohara Meghan M
Bought by
Mckenna Maureen A
Purchase Details
Closed on
Apr 29, 2003
Sold by
Mckenna Maureen A
Bought by
Mckenna Maureen A and Ohara Meghan M
Home Financials for this Owner
Home Financials are based on the most recent Mortgage that was taken out on this home.
Original Mortgage
$149,900
Interest Rate
5.64%
Mortgage Type
Purchase Money Mortgage
Purchase Details
Closed on
May 18, 2001
Sold by
Obrien Jeanne M
Bought by
Mckenna Maureen A
Home Financials for this Owner
Home Financials are based on the most recent Mortgage that was taken out on this home.
Original Mortgage
$129,950
Interest Rate
7.03%
Mortgage Type
Purchase Money Mortgage
Purchase Details
Closed on
Jul 30, 1998
Sold by
Marchi Carolyn M
Bought by
Obrien Jeanne M
Home Financials for this Owner
Home Financials are based on the most recent Mortgage that was taken out on this home.
Original Mortgage
$103,500
Interest Rate
6.92%
Mortgage Type
Purchase Money Mortgage
Purchase Details
Closed on
Aug 30, 1994
Sold by
Ingalls Darrell C and Ingalls Paula G
Bought by
Obrien Jeanne M and Marchi Carolyn M
Create a Home Valuation Report for This Property
The Home Valuation Report is an in-depth analysis detailing your home's value as well as a comparison with similar homes in the area
Home Values in the Area
Average Home Value in this Area
Purchase History
| Date | Buyer | Sale Price | Title Company |
|---|---|---|---|
| Mason Robert M | $134,000 | -- | |
| Federal National Mortgage Association | $170,808 | -- | |
| Kwartowitz Adam L | $192,500 | -- | |
| Mckenna Maureen A | -- | -- | |
| Mckenna Maureen A | -- | -- | |
| Mckenna Maureen A | $131,000 | -- | |
| Obrien Jeanne M | $4,000 | -- | |
| Obrien Jeanne M | $107,500 | -- |
Source: Public Records
Mortgage History
| Date | Status | Borrower | Loan Amount |
|---|---|---|---|
| Open | Federal National Mortgage Association | $130,603 | |
| Previous Owner | Kwartowitz Adam L | $182,875 | |
| Previous Owner | Mckenna Maureen A | $149,900 | |
| Previous Owner | Obrien Jeanne M | $32,000 | |
| Previous Owner | Obrien Jeanne M | $129,950 | |
| Previous Owner | Obrien Jeanne M | $103,500 |
Source: Public Records
Tax History Compared to Growth
Tax History
| Year | Tax Paid | Tax Assessment Tax Assessment Total Assessment is a certain percentage of the fair market value that is determined by local assessors to be the total taxable value of land and additions on the property. | Land | Improvement |
|---|---|---|---|---|
| 2025 | $3,740 | $251,500 | $111,600 | $139,900 |
| 2024 | $3,682 | $248,600 | $111,600 | $137,000 |
| 2023 | $3,549 | $228,400 | $111,600 | $116,800 |
| 2022 | $3,210 | $203,700 | $101,200 | $102,500 |
| 2021 | $3,211 | $190,000 | $94,500 | $95,500 |
| 2020 | $2,506 | $147,500 | $94,500 | $53,000 |
| 2019 | $2,502 | $147,500 | $94,500 | $53,000 |
| 2018 | $3,135 | $183,900 | $94,500 | $89,400 |
| 2017 | $3,135 | $183,900 | $94,500 | $89,400 |
| 2016 | $3,087 | $181,700 | $90,900 | $90,800 |
| 2015 | $3,026 | $178,100 | $89,100 | $89,000 |
| 2014 | $734 | $178,100 | $89,100 | $89,000 |
Source: Public Records
Map
Nearby Homes