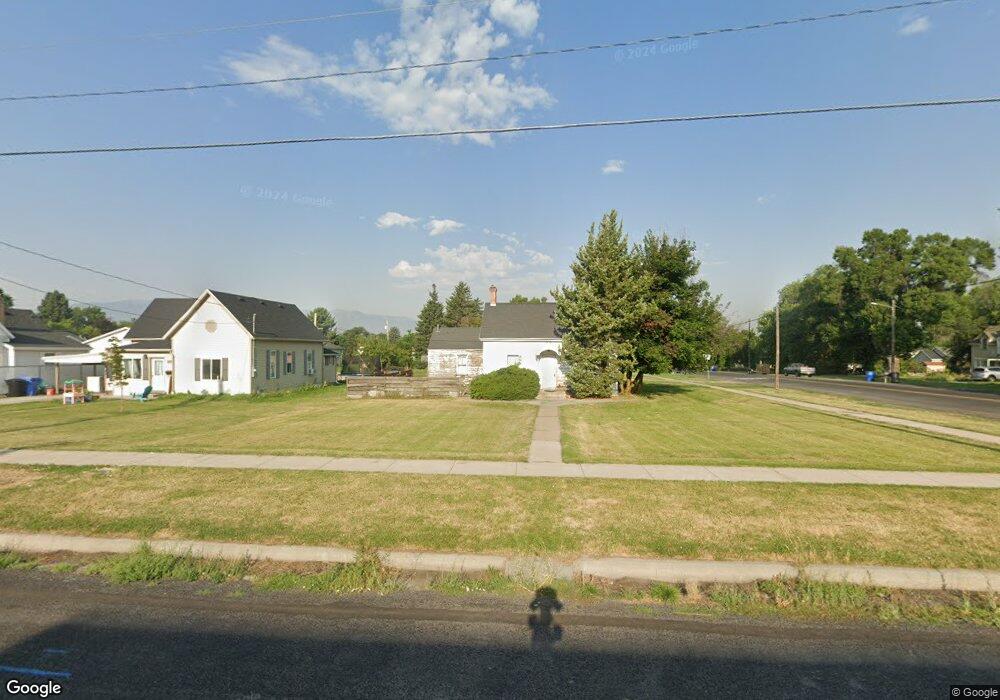
293 N 400 W Logan, UT 84321
Ellis NeighborhoodEstimated Value: $298,000 - $375,000
3
Beds
1
Bath
1,216
Sq Ft
$264/Sq Ft
Est. Value
About This Home
This home is located at 293 N 400 W, Logan, UT 84321 and is currently estimated at $321,382, approximately $264 per square foot. 293 N 400 W is a home located in Cache County with nearby schools including Ellis School, Mount Logan Middle School, and Logan High School.
Ownership History
Date
Name
Owned For
Owner Type
Purchase Details
Closed on
Oct 21, 2016
Sold by
Simon Alexander L
Bought by
Roadman Adrian
Current Estimated Value
Purchase Details
Closed on
Aug 1, 2012
Sold by
Larsen Carol and Larsen Family Trust
Bought by
Simon Alexander L
Purchase Details
Closed on
Mar 26, 2010
Sold by
Larsen Carol
Bought by
Larsen Carol and Larsen Family Trust
Purchase Details
Closed on
Apr 29, 2005
Sold by
The Alieta Fund Lc
Bought by
Larsen Brent H and Larsen Carol S
Home Financials for this Owner
Home Financials are based on the most recent Mortgage that was taken out on this home.
Original Mortgage
$78,400
Interest Rate
5.92%
Mortgage Type
New Conventional
Create a Home Valuation Report for This Property
The Home Valuation Report is an in-depth analysis detailing your home's value as well as a comparison with similar homes in the area
Home Values in the Area
Average Home Value in this Area
Purchase History
| Date | Buyer | Sale Price | Title Company |
|---|---|---|---|
| Roadman Adrian | -- | Pinnacle Title | |
| Simon Alexander L | -- | Pinnacle Title Ins Agency | |
| Larsen Carol | -- | None Available | |
| Larsen Brent H | -- | Northern Title Company |
Source: Public Records
Mortgage History
| Date | Status | Borrower | Loan Amount |
|---|---|---|---|
| Previous Owner | Larsen Brent H | $78,400 |
Source: Public Records
Tax History
| Year | Tax Paid | Tax Assessment Tax Assessment Total Assessment is a certain percentage of the fair market value that is determined by local assessors to be the total taxable value of land and additions on the property. | Land | Improvement |
|---|---|---|---|---|
| 2025 | $1,236 | $159,870 | $0 | $0 |
| 2024 | $1,269 | $158,935 | $0 | $0 |
| 2023 | $1,332 | $159,085 | $0 | $0 |
| 2022 | $1,292 | $144,000 | $0 | $0 |
| 2021 | $998 | $171,875 | $42,000 | $129,875 |
| 2020 | $915 | $141,904 | $42,000 | $99,904 |
| 2019 | $957 | $141,904 | $42,000 | $99,904 |
| 2018 | $969 | $131,200 | $42,000 | $89,200 |
| 2017 | $1,005 | $71,995 | $0 | $0 |
| 2016 | $1,042 | $57,310 | $0 | $0 |
| 2015 | $831 | $57,310 | $0 | $0 |
| 2014 | $751 | $57,310 | $0 | $0 |
| 2013 | -- | $57,310 | $0 | $0 |
Source: Public Records
Map
Nearby Homes
Your Personal Tour Guide
Ask me questions while you tour the home.