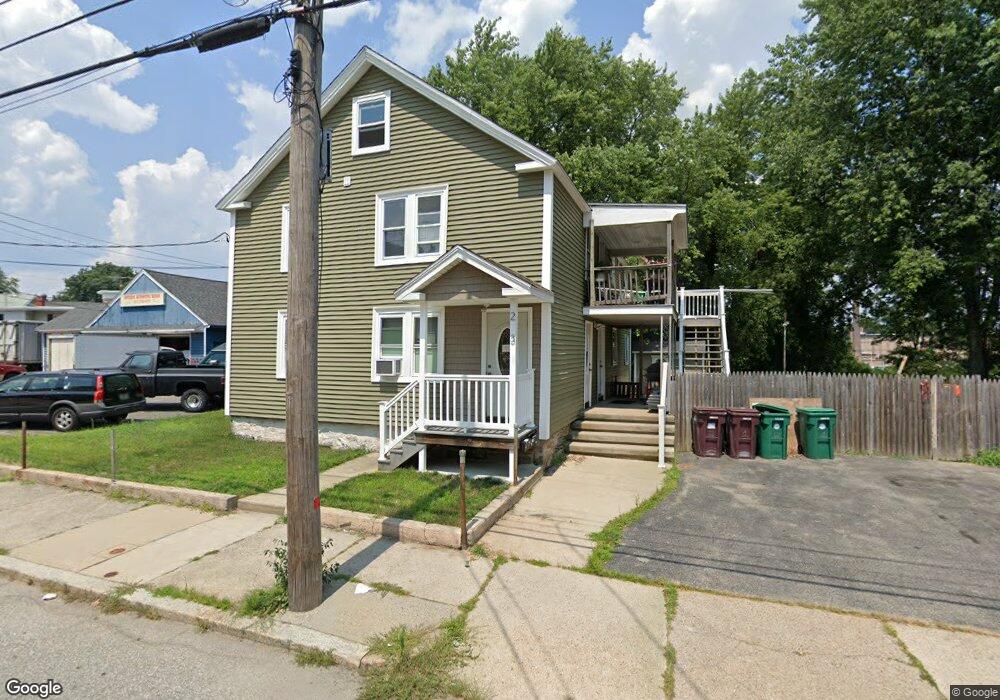
293 Olo St Woonsocket, RI 02895
Fairmount NeighborhoodEstimated Value: $436,000 - $517,000
6
Beds
2
Baths
2,236
Sq Ft
$213/Sq Ft
Est. Value
About This Home
This home is located at 293 Olo St, Woonsocket, RI 02895 and is currently estimated at $476,912, approximately $213 per square foot. 293 Olo St is a home located in Providence County with nearby schools including Woonsocket High School, Rise Prep Mayoral Academy Middle School, and Rise Prep Mayoral Academy.
Ownership History
Date
Name
Owned For
Owner Type
Purchase Details
Closed on
Sep 15, 2015
Sold by
Marquis Joseph R and Marquis Ronald G
Bought by
Young Andy A
Current Estimated Value
Purchase Details
Closed on
Apr 13, 2009
Sold by
Us Bk
Bought by
Marquis Ronald G and Marquis Joseph R
Purchase Details
Closed on
Aug 30, 2002
Sold by
Marquis Florian E and Marquis Claire D
Bought by
Rodrigues Joaquim
Create a Home Valuation Report for This Property
The Home Valuation Report is an in-depth analysis detailing your home's value as well as a comparison with similar homes in the area
Home Values in the Area
Average Home Value in this Area
Purchase History
| Date | Buyer | Sale Price | Title Company |
|---|---|---|---|
| Young Andy A | $137,000 | -- | |
| Young Andy A | $137,000 | -- | |
| Marquis Ronald G | $34,500 | -- | |
| Marquis Ronald G | $34,500 | -- | |
| Rodrigues Joaquim | $117,000 | -- | |
| Rodrigues Joaquim | $117,000 | -- |
Source: Public Records
Mortgage History
| Date | Status | Borrower | Loan Amount |
|---|---|---|---|
| Previous Owner | Rodrigues Joaquim | $50,000 | |
| Previous Owner | Rodrigues Joaquim | $195,000 | |
| Previous Owner | Rodrigues Joaquim | $169,000 |
Source: Public Records
Tax History
| Year | Tax Paid | Tax Assessment Tax Assessment Total Assessment is a certain percentage of the fair market value that is determined by local assessors to be the total taxable value of land and additions on the property. | Land | Improvement |
|---|---|---|---|---|
| 2025 | $5,048 | $449,500 | $90,800 | $358,700 |
| 2024 | $4,525 | $311,200 | $92,500 | $218,700 |
| 2023 | $4,351 | $311,200 | $92,500 | $218,700 |
| 2022 | $4,351 | $311,200 | $92,500 | $218,700 |
| 2021 | $3,541 | $149,100 | $37,700 | $111,400 |
| 2020 | $3,578 | $149,100 | $37,700 | $111,400 |
| 2018 | $3,590 | $149,100 | $37,700 | $111,400 |
| 2017 | $4,331 | $143,900 | $41,200 | $102,700 |
| 2016 | $4,582 | $143,900 | $41,200 | $102,700 |
| 2015 | $5,264 | $143,900 | $41,200 | $102,700 |
| 2014 | $5,513 | $153,400 | $45,400 | $108,000 |
Source: Public Records
Map
Nearby Homes
Your Personal Tour Guide
Ask me questions while you tour the home.