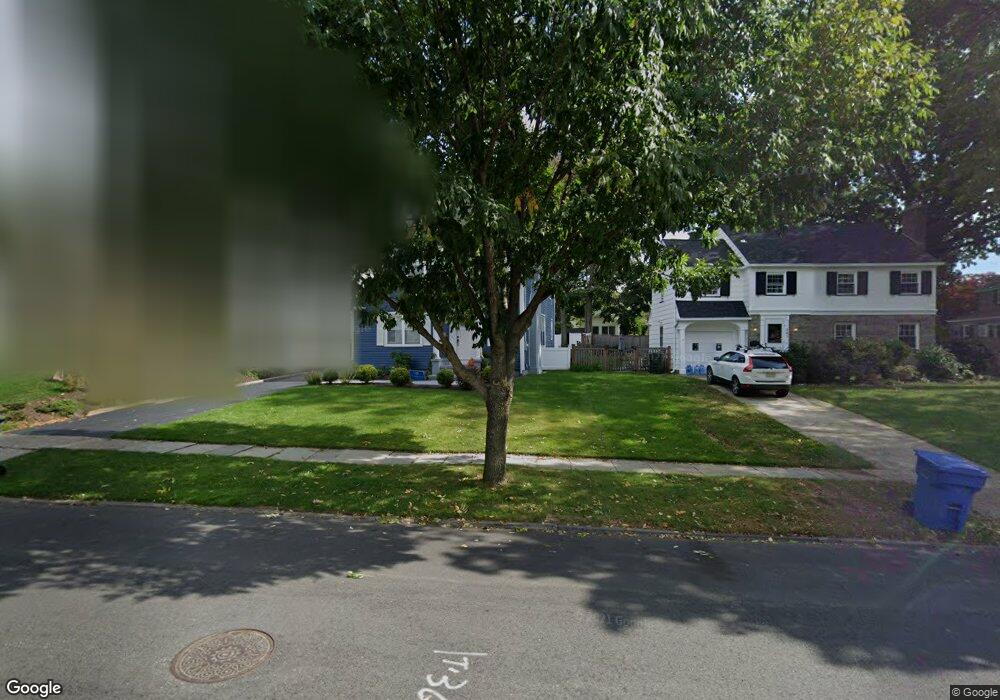
293 Ridge Rd Rutherford, NJ 07070
Estimated Value: $719,000 - $991,000
3
Beds
4
Baths
1,416
Sq Ft
$609/Sq Ft
Est. Value
About This Home
This home is located at 293 Ridge Rd, Rutherford, NJ 07070 and is currently estimated at $861,918, approximately $608 per square foot. 293 Ridge Rd is a home located in Bergen County with nearby schools including Rutherford High School, Sacred Heart School, and The Academy at Saint Mary.
Ownership History
Date
Name
Owned For
Owner Type
Purchase Details
Closed on
Mar 26, 2021
Sold by
Cuevas Elizabeth
Bought by
Kolb Jayson and Kolb Allison
Current Estimated Value
Home Financials for this Owner
Home Financials are based on the most recent Mortgage that was taken out on this home.
Original Mortgage
$584,000
Outstanding Balance
$528,123
Interest Rate
3.1%
Mortgage Type
New Conventional
Estimated Equity
$333,795
Purchase Details
Closed on
Jun 14, 2018
Sold by
Nizborski Dawid and Nizborski Dariusz B
Bought by
Chevas Elizabeth
Home Financials for this Owner
Home Financials are based on the most recent Mortgage that was taken out on this home.
Original Mortgage
$603,000
Interest Rate
4.6%
Mortgage Type
Purchase Money Mortgage
Purchase Details
Closed on
Aug 22, 2017
Sold by
Wurm Dorothy and Estate Of Dorothy Wurm
Bought by
Nizborski Dariusz B and Nizborski Dawid
Create a Home Valuation Report for This Property
The Home Valuation Report is an in-depth analysis detailing your home's value as well as a comparison with similar homes in the area
Home Values in the Area
Average Home Value in this Area
Purchase History
| Date | Buyer | Sale Price | Title Company |
|---|---|---|---|
| Kolb Jayson | $730,000 | None Available | |
| Kolb Jayson | $730,000 | Investment Title | |
| Chevas Elizabeth | $670,000 | -- | |
| Nizborski Dariusz B | $380,000 | None Available |
Source: Public Records
Mortgage History
| Date | Status | Borrower | Loan Amount |
|---|---|---|---|
| Open | Kolb Jayson | $584,000 | |
| Closed | Kolb Jayson | $584,000 | |
| Previous Owner | Chevas Elizabeth | $603,000 |
Source: Public Records
Tax History
| Year | Tax Paid | Tax Assessment Tax Assessment Total Assessment is a certain percentage of the fair market value that is determined by local assessors to be the total taxable value of land and additions on the property. | Land | Improvement |
|---|---|---|---|---|
| 2025 | $17,340 | $555,600 | $293,400 | $262,200 |
| 2024 | $16,901 | $555,600 | $293,400 | $262,200 |
| 2023 | $16,496 | $555,600 | $293,400 | $262,200 |
| 2022 | $16,496 | $555,600 | $293,400 | $262,200 |
| 2021 | $16,274 | $555,600 | $293,400 | $262,200 |
| 2020 | $15,840 | $555,600 | $293,400 | $262,200 |
| 2019 | $15,218 | $555,600 | $293,400 | $262,200 |
| 2018 | $12,603 | $466,600 | $293,400 | $173,200 |
| 2017 | $12,426 | $466,600 | $293,400 | $173,200 |
| 2016 | $12,150 | $466,600 | $293,400 | $173,200 |
| 2015 | $11,569 | $466,600 | $293,400 | $173,200 |
| 2014 | $11,200 | $466,600 | $293,400 | $173,200 |
Source: Public Records
Map
Nearby Homes
- 317 Ridge Rd
- 222 Ridge Rd
- 121 Woodland Ave
- 331 Mountain Way
- 631 6th Ave
- 73 Addison Ave
- 223 Orient Way
- 15 E Pierrepont Ave
- 47 Elycroft Pkwy
- 33 Elycroft Pkwy
- 11 W Gouverneur Ave
- 87 Ridge Rd
- 54 Stuyvesant Ave
- 130 Orient Way Unit 3D
- 130 Orient Way Unit 4H
- 217 Mountain Way
- 27 Donaldson Ave
- 114 Orient Way
- 648 Milton Ave
- 539 Freeman St
Your Personal Tour Guide
Ask me questions while you tour the home.