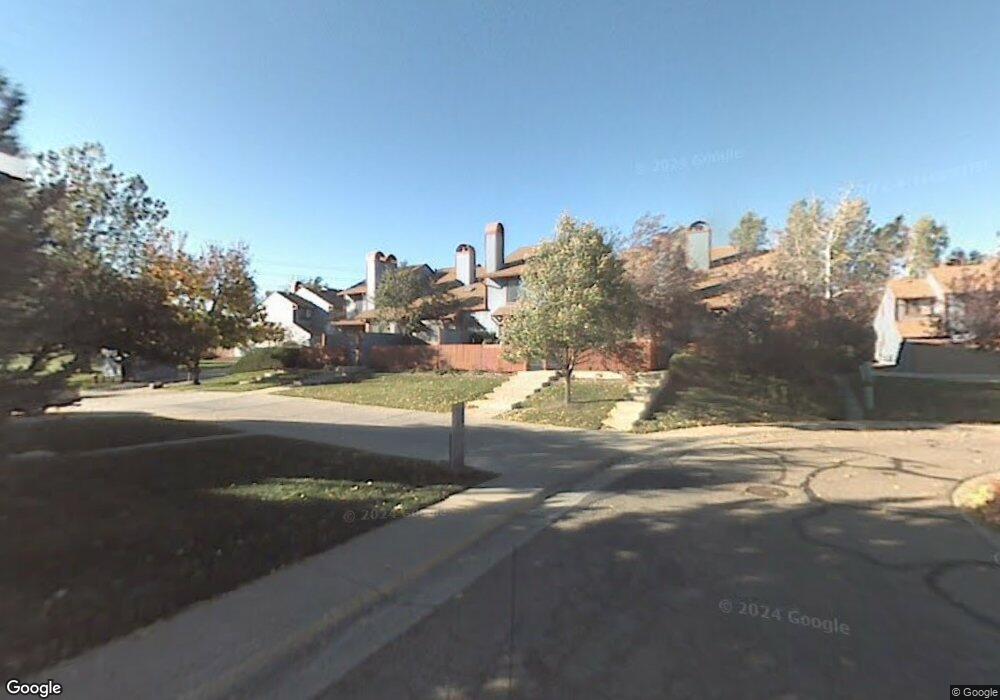
293 S Taft Ct Unit 46 Louisville, CO 80027
Estimated Value: $401,708 - $435,000
2
Beds
1
Bath
884
Sq Ft
$480/Sq Ft
Est. Value
About This Home
This home is located at 293 S Taft Ct Unit 46, Louisville, CO 80027 and is currently estimated at $424,177, approximately $479 per square foot. 293 S Taft Ct Unit 46 is a home located in Boulder County with nearby schools including Fireside Elementary School, Monarch K-8 School, and Monarch High School.
Ownership History
Date
Name
Owned For
Owner Type
Purchase Details
Closed on
Jan 7, 1998
Sold by
Snyder David S
Bought by
Cianflone Cover Isabel S
Current Estimated Value
Home Financials for this Owner
Home Financials are based on the most recent Mortgage that was taken out on this home.
Original Mortgage
$33,000
Outstanding Balance
$6,099
Interest Rate
7.87%
Estimated Equity
$418,078
Purchase Details
Closed on
Aug 20, 1996
Sold by
Guthrie David E
Bought by
Snyder David S
Home Financials for this Owner
Home Financials are based on the most recent Mortgage that was taken out on this home.
Original Mortgage
$83,200
Interest Rate
8.27%
Mortgage Type
Balloon
Purchase Details
Closed on
Sep 28, 1995
Sold by
Melgaard Andy and Melgaard Alan D
Bought by
Guthrie David E
Home Financials for this Owner
Home Financials are based on the most recent Mortgage that was taken out on this home.
Original Mortgage
$101,900
Interest Rate
6.5%
Mortgage Type
FHA
Purchase Details
Closed on
Mar 17, 1993
Bought by
Cianflone-Cover Isabel S
Create a Home Valuation Report for This Property
The Home Valuation Report is an in-depth analysis detailing your home's value as well as a comparison with similar homes in the area
Home Values in the Area
Average Home Value in this Area
Purchase History
| Date | Buyer | Sale Price | Title Company |
|---|---|---|---|
| Cianflone Cover Isabel S | $114,000 | Land Title | |
| Snyder David S | $104,000 | -- | |
| Guthrie David E | $105,000 | -- | |
| Cianflone-Cover Isabel S | $76,500 | -- |
Source: Public Records
Mortgage History
| Date | Status | Borrower | Loan Amount |
|---|---|---|---|
| Open | Cianflone Cover Isabel S | $33,000 | |
| Previous Owner | Snyder David S | $83,200 | |
| Previous Owner | Guthrie David E | $101,900 |
Source: Public Records
Tax History Compared to Growth
Tax History
| Year | Tax Paid | Tax Assessment Tax Assessment Total Assessment is a certain percentage of the fair market value that is determined by local assessors to be the total taxable value of land and additions on the property. | Land | Improvement |
|---|---|---|---|---|
| 2025 | $1,675 | $27,919 | -- | $27,919 |
| 2024 | $1,675 | $27,919 | -- | $27,919 |
| 2023 | $1,647 | $25,338 | -- | $29,023 |
| 2022 | $2,030 | $21,093 | $0 | $21,093 |
| 2021 | $2,310 | $24,946 | $0 | $24,946 |
| 2020 | $2,137 | $22,837 | $0 | $22,837 |
| 2019 | $2,107 | $22,837 | $0 | $22,837 |
| 2018 | $1,954 | $21,874 | $0 | $21,874 |
| 2017 | $1,915 | $24,182 | $0 | $24,182 |
| 2016 | $1,498 | $17,026 | $0 | $17,026 |
| 2015 | $1,420 | $14,240 | $0 | $14,240 |
| 2014 | $1,217 | $14,240 | $0 | $14,240 |
Source: Public Records
Map
Nearby Homes
- 279 S Taft Ct Unit 53
- 323 S Taft Ct Unit 26
- 305 S Taft Ct Unit 33
- 284 S Taft Ct Unit 76
- 362 S Taft Ct Unit 108
- 641 W Dahlia St
- 749 Apple Ct
- 174 Cherrywood Ln
- 118 S Tanager Ct
- 812 W Mulberry St
- 159 S Polk Ave
- 546 Ridgeview Dr
- 572 Ridgeview Dr
- 567 Manorwood Ln
- 590 Manorwood Ln N
- 539 Coal Creek Ln
- 620 Ridgeview Dr
- 408 Fillmore Ct
- 494 Owl Dr Unit 4
- 730 Copper Ln Unit 106
- 291 S Taft Ct Unit 47
- 299 S Taft Ct Unit 43
- 289 S Taft Ct Unit 48
- 295 S Taft Ct Unit 45
- 297 S Taft Ct Unit 44
- 281 S Taft Ct Unit 52
- 283 S Taft Ct Unit 51
- 285 S Taft Ct Unit 50
- 287 S Taft Ct Unit 49
- 275 S Taft Ct Unit 42
- 273 S Taft Ct Unit 41
- 271 S Taft Ct Unit 40
- 269 S Taft Ct Unit 39
- 267 S Taft Ct Unit 38
- 265 S Taft Ct Unit 37
- 768 W Aspen Way
- 776 W Aspen Way
- 754 W Aspen Way
- 309 S Taft Ct Unit 35
- 303 S Taft Ct Unit 32