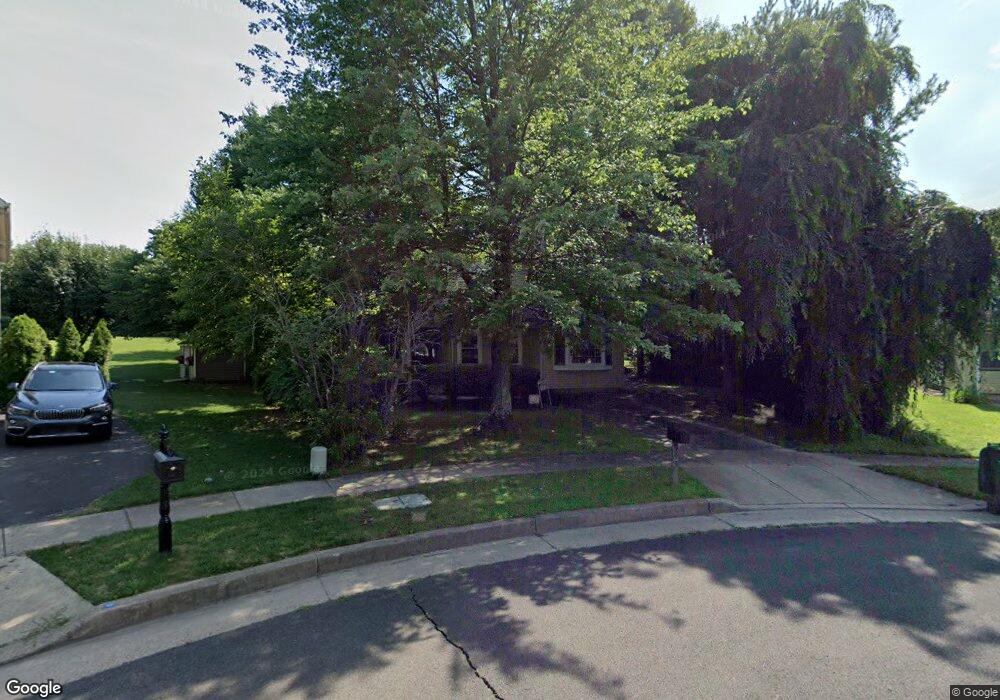
293 Stanford Place Newtown, PA 18940
Estimated Value: $631,353 - $758,000
3
Beds
2
Baths
1,818
Sq Ft
$383/Sq Ft
Est. Value
About This Home
This home is located at 293 Stanford Place, Newtown, PA 18940 and is currently estimated at $697,088, approximately $383 per square foot. 293 Stanford Place is a home located in Bucks County with nearby schools including Goodnoe Elementary School, Newtown Middle School, and Council Rock High School North.
Ownership History
Date
Name
Owned For
Owner Type
Purchase Details
Closed on
Jan 13, 2015
Sold by
Ninatoski Kristy
Bought by
Ninatoski Nicholaus
Current Estimated Value
Purchase Details
Closed on
Sep 8, 2009
Sold by
Mullin Guy S and Townsend Mullin Michelle
Bought by
Ninatoski Nicholaus B and Ninatoski Kristy L
Home Financials for this Owner
Home Financials are based on the most recent Mortgage that was taken out on this home.
Original Mortgage
$310,250
Outstanding Balance
$202,386
Interest Rate
5.14%
Mortgage Type
New Conventional
Estimated Equity
$494,702
Purchase Details
Closed on
Aug 16, 1996
Sold by
Fowler John Woolley and Fowler Ann Ward
Bought by
Mullin Guy S and Townsend Mullin Michelle
Home Financials for this Owner
Home Financials are based on the most recent Mortgage that was taken out on this home.
Original Mortgage
$160,550
Interest Rate
8.4%
Create a Home Valuation Report for This Property
The Home Valuation Report is an in-depth analysis detailing your home's value as well as a comparison with similar homes in the area
Home Values in the Area
Average Home Value in this Area
Purchase History
| Date | Buyer | Sale Price | Title Company |
|---|---|---|---|
| Ninatoski Nicholaus | -- | None Available | |
| Ninatoski Nicholaus B | $365,000 | None Available | |
| Mullin Guy S | $169,000 | -- |
Source: Public Records
Mortgage History
| Date | Status | Borrower | Loan Amount |
|---|---|---|---|
| Open | Ninatoski Nicholaus B | $310,250 | |
| Previous Owner | Mullin Guy S | $160,550 |
Source: Public Records
Tax History Compared to Growth
Tax History
| Year | Tax Paid | Tax Assessment Tax Assessment Total Assessment is a certain percentage of the fair market value that is determined by local assessors to be the total taxable value of land and additions on the property. | Land | Improvement |
|---|---|---|---|---|
| 2025 | $6,561 | $36,920 | $6,960 | $29,960 |
| 2024 | $6,561 | $36,920 | $6,960 | $29,960 |
| 2023 | $6,278 | $36,920 | $6,960 | $29,960 |
| 2022 | $6,156 | $36,920 | $6,960 | $29,960 |
| 2021 | $6,061 | $36,920 | $6,960 | $29,960 |
| 2020 | $5,769 | $36,920 | $6,960 | $29,960 |
| 2019 | $5,632 | $36,920 | $6,960 | $29,960 |
| 2018 | $5,525 | $36,920 | $6,960 | $29,960 |
| 2017 | $5,334 | $36,920 | $6,960 | $29,960 |
| 2016 | $5,297 | $36,920 | $6,960 | $29,960 |
| 2015 | -- | $36,920 | $6,960 | $29,960 |
| 2014 | -- | $36,920 | $6,960 | $29,960 |
Source: Public Records
Map
Nearby Homes
- 215 Rumford Ct
- 513 Atwood Ct
- 12 Farmington Place
- 144 Yeates Alley
- 35 Essex Place
- 206 Paxon Alley Unit 51
- 2 Farmington Place
- 101 N Norwood Ave
- 106 Hicks Alley
- 3 Farmington Place
- 8 Bennington Place
- 52 Yorkshire Dr
- 313 Washington Ave
- 143 N State St
- 9 Pickering Dr
- 532 Penn St
- 25 Wellington Rd
- 44 Aster Way
- 113 Penn St
- 22 Penn St
- 299 Stanford Place
- 281 Stanford Place
- 296 Stanford Place
- 275 Stanford Place
- 290 Stanford Place
- 284 Stanford Place
- 269 Stanford Place
- 278 Stanford Place
- 263 Stanford Place
- 272 Stanford Place
- 266 Stanford Place
- 22 S Ascot Ct
- 22 S Ascot Ct
- 260 Stanford Place
- 18 S Ascot Ct
- 254 Stanford Place
- 311 Merion Place
- 14 S Ascot Ct
- 310 Merion Place
- 17 S Ascot Ct