Estimated Value: $480,000 - $541,000
4
Beds
4
Baths
1,820
Sq Ft
$274/Sq Ft
Est. Value
About This Home
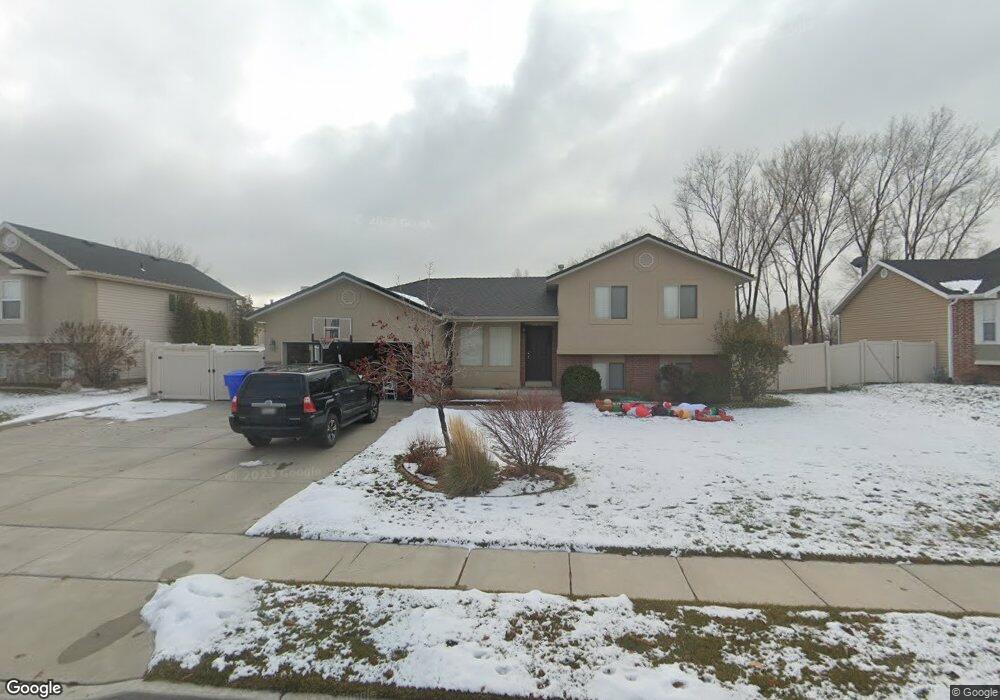
This home is located at 293 W 1700 N, Ogden, UT 84414 and is currently estimated at $498,850, approximately $274 per square foot. 293 W 1700 N is a home located in Weber County with nearby schools including Pioneer School, Orion Junior High School, and Weber High School.
Ownership History
Date
Name
Owned For
Owner Type
Purchase Details
Closed on
Oct 16, 2018
Sold by
Scott Ryan R and Scott Leslie
Bought by
Mcintyre Stephen P and Mcintyre Rebecca A
Current Estimated Value
Purchase Details
Closed on
Apr 29, 2008
Sold by
Cinq Mars Joshua A
Bought by
Scott Ryan R and Scott Leslie
Purchase Details
Closed on
Aug 21, 2003
Sold by
S M Carter Co
Bought by
Cinq Mars Joshua A
Home Financials for this Owner
Home Financials are based on the most recent Mortgage that was taken out on this home.
Original Mortgage
$149,430
Interest Rate
5.46%
Mortgage Type
VA
Purchase Details
Closed on
Sep 16, 2002
Sold by
Ben Lomond Estates Llc
Bought by
S M Carter Company
Home Financials for this Owner
Home Financials are based on the most recent Mortgage that was taken out on this home.
Original Mortgage
$123,000
Interest Rate
6.24%
Create a Home Valuation Report for This Property
The Home Valuation Report is an in-depth analysis detailing your home's value as well as a comparison with similar homes in the area
Home Values in the Area
Average Home Value in this Area
Purchase History
| Date | Buyer | Sale Price | Title Company |
|---|---|---|---|
| Mcintyre Stephen P | -- | Metro National Title | |
| Scott Ryan R | -- | First American Layton | |
| Cinq Mars Joshua A | -- | Security Title | |
| S M Carter Company | -- | Bonneville Title |
Source: Public Records
Mortgage History
| Date | Status | Borrower | Loan Amount |
|---|---|---|---|
| Previous Owner | Cinq Mars Joshua A | $149,430 | |
| Previous Owner | S M Carter Company | $123,000 |
Source: Public Records
Tax History Compared to Growth
Tax History
| Year | Tax Paid | Tax Assessment Tax Assessment Total Assessment is a certain percentage of the fair market value that is determined by local assessors to be the total taxable value of land and additions on the property. | Land | Improvement |
|---|---|---|---|---|
| 2025 | $3,005 | $449,680 | $159,988 | $289,692 |
| 2024 | $2,971 | $444,000 | $159,988 | $284,012 |
| 2023 | $3,127 | $479,000 | $159,858 | $319,142 |
| 2022 | $2,984 | $470,000 | $140,006 | $329,994 |
| 2021 | $2,494 | $367,000 | $80,055 | $286,945 |
| 2020 | $2,258 | $309,000 | $65,013 | $243,987 |
| 2019 | $2,122 | $278,000 | $59,880 | $218,120 |
| 2018 | $2,016 | $252,000 | $59,880 | $192,120 |
| 2017 | $1,755 | $204,000 | $55,992 | $148,008 |
| 2016 | $1,714 | $107,644 | $25,603 | $82,041 |
| 2015 | $1,722 | $107,644 | $25,603 | $82,041 |
| 2014 | $1,568 | $94,930 | $25,603 | $69,327 |
Source: Public Records
Map
Nearby Homes
- 1743 N 400 W
- 178 W 1750 N
- 247 E 1825 N Unit 10
- 247 E 1825 N Unit 11
- 2458 N Highway 89 Hwy
- 1964 N 225 W
- 1953 N 275 W Unit 13
- 1960 N 275 W Unit 29
- 108 W 1875 N
- 112 E 1475 N
- 2440 U S Highway 89
- 416 W 1925 N
- 1307 N 225 W
- 247 E 1850 N Unit 5
- 1759 N 300 E Unit 128
- 315 E 1650 N Unit 129
- 265 E 1900 N
- 270 E 1825 N Unit 53
- 1196 N 375 W Unit 1
- Dearborn Plan at Ashlar Cove