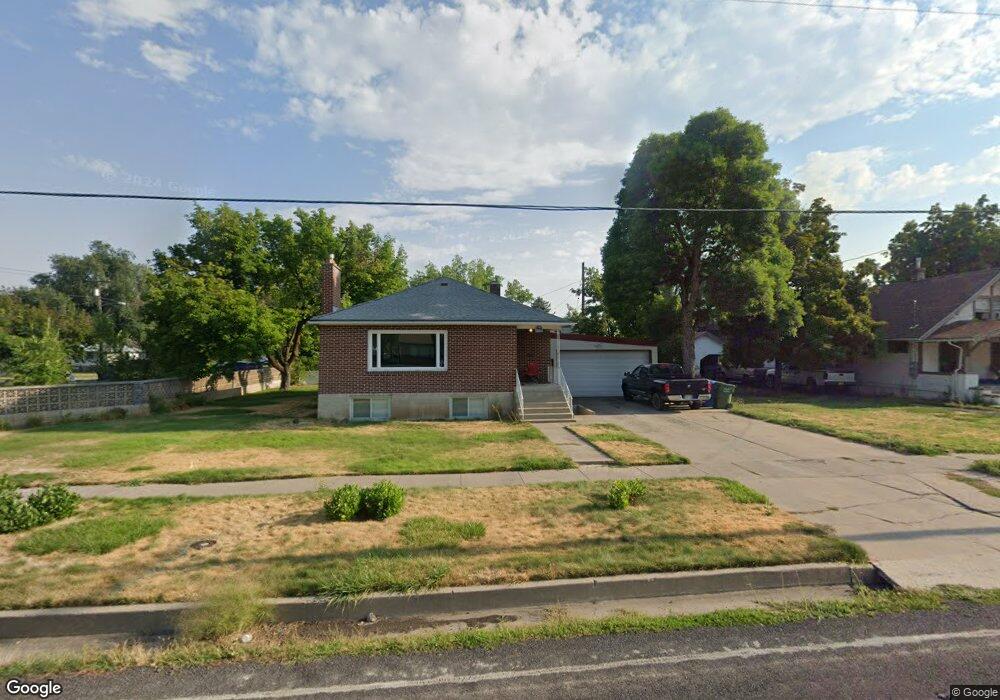
293 W 300 N Logan, UT 84321
Ellis NeighborhoodEstimated Value: $405,000 - $437,000
4
Beds
2
Baths
2,756
Sq Ft
$155/Sq Ft
Est. Value
About This Home
This home is located at 293 W 300 N, Logan, UT 84321 and is currently estimated at $426,942, approximately $154 per square foot. 293 W 300 N is a home located in Cache County with nearby schools including Ellis School, Mount Logan Middle School, and Logan High School.
Ownership History
Date
Name
Owned For
Owner Type
Purchase Details
Closed on
Dec 18, 2025
Sold by
Church Of Jesus Christ Of Latter-Day Sai
Bought by
Deseret Farms Llc
Current Estimated Value
Purchase Details
Closed on
Jul 9, 2024
Sold by
Reid Revocable Trust and Reid Karl
Bought by
Hernandez Heber
Home Financials for this Owner
Home Financials are based on the most recent Mortgage that was taken out on this home.
Original Mortgage
$315,000
Interest Rate
7.03%
Mortgage Type
New Conventional
Purchase Details
Closed on
Jun 13, 2010
Sold by
Reid Voniel J and The Reid Family Trust
Bought by
Reid Voniel J and The Reid Revocable Trust
Create a Home Valuation Report for This Property
The Home Valuation Report is an in-depth analysis detailing your home's value as well as a comparison with similar homes in the area
Home Values in the Area
Average Home Value in this Area
Purchase History
| Date | Buyer | Sale Price | Title Company |
|---|---|---|---|
| Deseret Farms Llc | -- | Fnt Utah Downtown Slc | |
| Hernandez Heber | -- | Advanced Title | |
| Hernandez Heber | -- | Advanced Title | |
| Reid Voniel J | -- | None Available |
Source: Public Records
Mortgage History
| Date | Status | Borrower | Loan Amount |
|---|---|---|---|
| Previous Owner | Hernandez Heber | $315,000 |
Source: Public Records
Tax History
| Year | Tax Paid | Tax Assessment Tax Assessment Total Assessment is a certain percentage of the fair market value that is determined by local assessors to be the total taxable value of land and additions on the property. | Land | Improvement |
|---|---|---|---|---|
| 2025 | $1,795 | $232,200 | $0 | $0 |
| 2024 | $1,853 | $232,175 | $0 | $0 |
| 2023 | $1,925 | $229,810 | $0 | $0 |
| 2022 | $2,061 | $229,815 | $0 | $0 |
| 2021 | $1,697 | $292,250 | $42,000 | $250,250 |
| 2020 | $1,513 | $234,500 | $42,000 | $192,500 |
| 2019 | $1,581 | $234,500 | $42,000 | $192,500 |
| 2018 | $1,327 | $179,648 | $42,000 | $137,648 |
| 2017 | $1,267 | $90,695 | $0 | $0 |
| 2016 | $1,313 | $85,195 | $0 | $0 |
| 2015 | $1,235 | $85,195 | $0 | $0 |
| 2014 | $1,116 | $85,195 | $0 | $0 |
| 2013 | -- | $79,325 | $0 | $0 |
Source: Public Records
Map
Nearby Homes
Your Personal Tour Guide
Ask me questions while you tour the home.