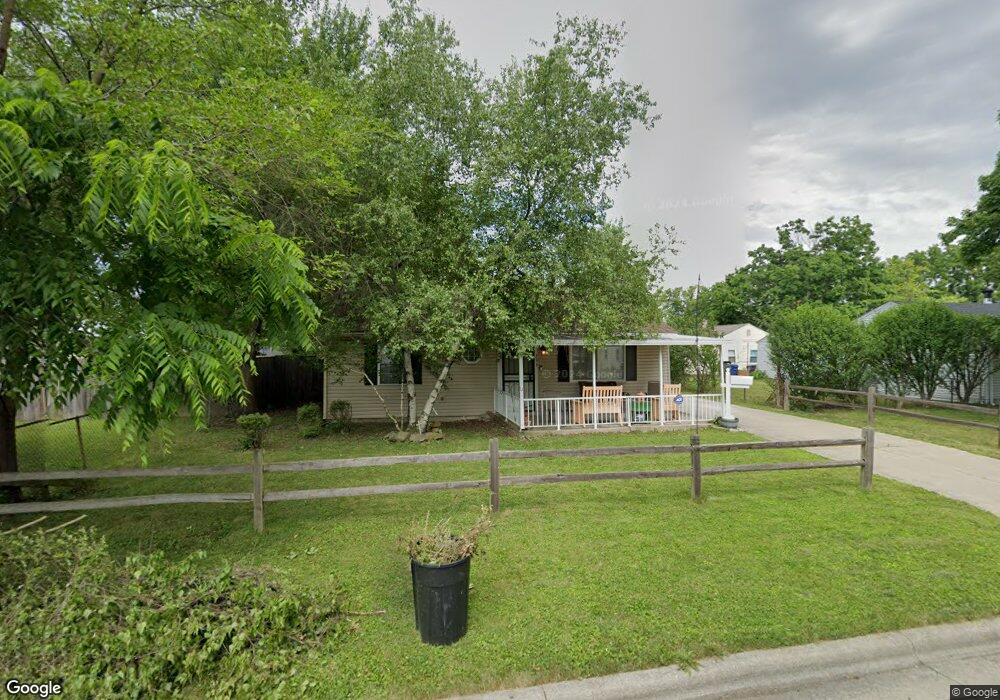
293 Westphal Ave Columbus, OH 43213
Estimated Value: $183,000 - $218,000
4
Beds
1
Bath
1,421
Sq Ft
$136/Sq Ft
Est. Value
About This Home
This home is located at 293 Westphal Ave, Columbus, OH 43213 and is currently estimated at $193,782, approximately $136 per square foot. 293 Westphal Ave is a home located in Franklin County with nearby schools including Etna Road Elementary School, Beechwood Elementary School, and Rosemore Middle School.
Ownership History
Date
Name
Owned For
Owner Type
Purchase Details
Closed on
Jul 30, 2010
Sold by
Stewart Larry L
Bought by
Ore Michael T and Ore Michael
Current Estimated Value
Purchase Details
Closed on
Jan 28, 2010
Sold by
Deutsche Bank National Trust Company
Bought by
Stewart Larry L
Purchase Details
Closed on
Nov 16, 2009
Sold by
Lilly Stacy A and Lilly Tim R
Bought by
Deutsche Bank National Trust Company
Purchase Details
Closed on
Mar 10, 2000
Sold by
Scott Michael D
Bought by
Lilly Stacy A
Home Financials for this Owner
Home Financials are based on the most recent Mortgage that was taken out on this home.
Original Mortgage
$72,500
Interest Rate
8.26%
Purchase Details
Closed on
Feb 16, 1994
Bought by
Scott Michael D
Purchase Details
Closed on
Jun 1, 1987
Purchase Details
Closed on
Oct 1, 1985
Create a Home Valuation Report for This Property
The Home Valuation Report is an in-depth analysis detailing your home's value as well as a comparison with similar homes in the area
Home Values in the Area
Average Home Value in this Area
Purchase History
| Date | Buyer | Sale Price | Title Company |
|---|---|---|---|
| Ore Michael T | $70,500 | Trinity Tit | |
| Stewart Larry L | $35,100 | Attorney | |
| Deutsche Bank National Trust Company | $50,000 | Attorney | |
| Lilly Stacy A | $73,500 | -- | |
| Scott Michael D | $61,000 | -- | |
| -- | -- | -- | |
| -- | -- | -- |
Source: Public Records
Mortgage History
| Date | Status | Borrower | Loan Amount |
|---|---|---|---|
| Previous Owner | Lilly Stacy A | $72,500 |
Source: Public Records
Tax History Compared to Growth
Tax History
| Year | Tax Paid | Tax Assessment Tax Assessment Total Assessment is a certain percentage of the fair market value that is determined by local assessors to be the total taxable value of land and additions on the property. | Land | Improvement |
|---|---|---|---|---|
| 2024 | $2,074 | $46,340 | $12,180 | $34,160 |
| 2023 | $2,060 | $46,340 | $12,180 | $34,160 |
| 2022 | $1,438 | $24,570 | $5,040 | $19,530 |
| 2021 | $1,352 | $24,570 | $5,040 | $19,530 |
| 2020 | $1,339 | $24,570 | $5,040 | $19,530 |
| 2019 | $1,227 | $19,570 | $4,030 | $15,540 |
| 2018 | $625 | $19,570 | $4,030 | $15,540 |
| 2017 | $1,187 | $19,570 | $4,030 | $15,540 |
| 2016 | $1,517 | $22,580 | $4,060 | $18,520 |
| 2015 | $704 | $20,790 | $4,060 | $16,730 |
| 2014 | $1,409 | $20,790 | $4,060 | $16,730 |
| 2013 | $745 | $23,100 | $4,515 | $18,585 |
Source: Public Records
Map
Nearby Homes
- 4489 Saint Margaret Ln
- 4368 Broadhurst Dr
- 451 Beaver Ave
- 4572 Saint Anthony Ln
- 4148 Elbern Ave
- 571 S Hamilton Rd
- 579 Westphal Ave
- 353 Shell Ct E
- 469 Cumberland Dr
- 4653 Kae Ave
- 424 Cumberland Dr
- 4780 Etna Rd Unit 782
- 4662 Jae Ave
- 322 Fairway Cir
- 91 Robinwood Ave
- 798 S Yearling Rd
- 547 Country Club Rd
- 3814 Elbern Ave
- 320 Collingwood Ave
- 4094 E Main St
- 299 Westphal Ave
- 287 Westphal Ave
- 4446 Saint Margaret Ln
- 4449 Saint Ann Ln
- 4438 Saint Margaret Ln
- 4445 Saint Ann Ln
- 296 Westphal Ave
- 302 Westphal Ave
- 290 Westphal Ave
- 4437 Saint Ann Ln
- 4432 Saint Margaret Ln
- 4482 Saint Margaret Ln
- 4487 Saint Ann Ln
- 4472 St Ann Ln
- 4426 Saint Margaret Ln
- 4431 Saint Ann Ln
- 4458 Saint Ann Ln
- 4466 Saint Ann Ln
- 4453 Saint Margaret Ln
- 4445 Saint Margaret Ln