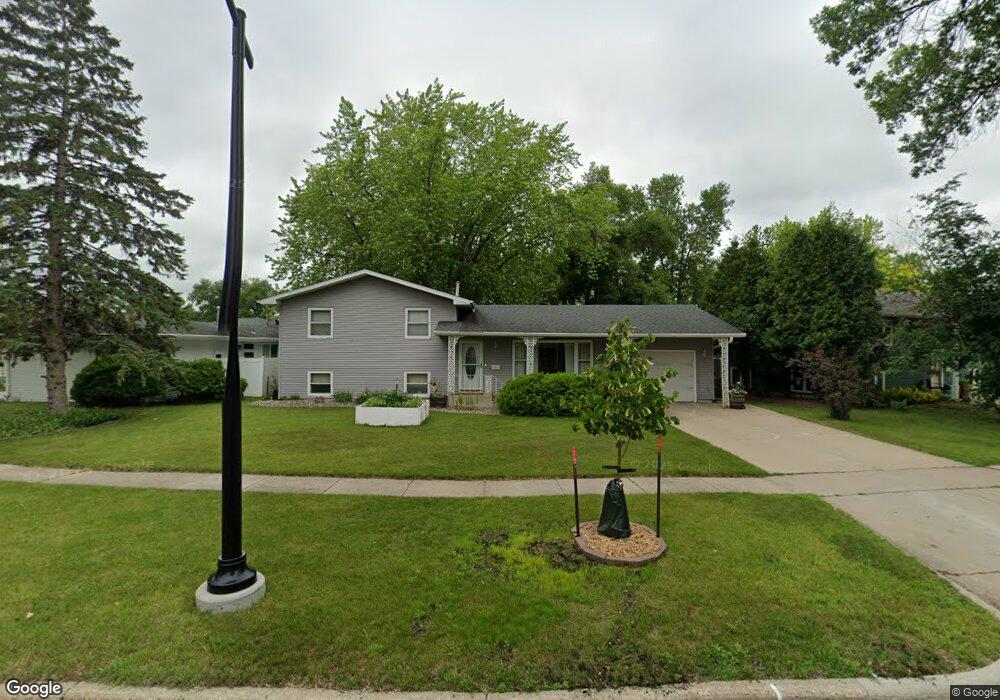
2930 3rd St N Fargo, ND 58102
Northport NeighborhoodEstimated Value: $320,011 - $346,000
4
Beds
2
Baths
2,145
Sq Ft
$155/Sq Ft
Est. Value
About This Home
This home is located at 2930 3rd St N, Fargo, ND 58102 and is currently estimated at $332,503, approximately $155 per square foot. 2930 3rd St N is a home located in Cass County with nearby schools including McKinley Elementary School, Ben Franklin Middle School, and North High School.
Ownership History
Date
Name
Owned For
Owner Type
Purchase Details
Closed on
Apr 11, 2020
Sold by
Malinowski Kevin and Malinowski Jerica
Bought by
Malinowski Kevin
Current Estimated Value
Home Financials for this Owner
Home Financials are based on the most recent Mortgage that was taken out on this home.
Original Mortgage
$170,701
Outstanding Balance
$150,933
Interest Rate
3.3%
Mortgage Type
New Conventional
Estimated Equity
$181,570
Purchase Details
Closed on
Jan 22, 2016
Sold by
Bennett John R and Bennett Dena
Bought by
Malinowski Kevin and Malinowski Jerica
Home Financials for this Owner
Home Financials are based on the most recent Mortgage that was taken out on this home.
Original Mortgage
$175,655
Interest Rate
3.93%
Mortgage Type
New Conventional
Purchase Details
Closed on
Mar 14, 2014
Sold by
Campbell Duane R
Bought by
Bennett John R and Bennett Dena
Home Financials for this Owner
Home Financials are based on the most recent Mortgage that was taken out on this home.
Original Mortgage
$155,325
Interest Rate
4.35%
Mortgage Type
New Conventional
Create a Home Valuation Report for This Property
The Home Valuation Report is an in-depth analysis detailing your home's value as well as a comparison with similar homes in the area
Home Values in the Area
Average Home Value in this Area
Purchase History
| Date | Buyer | Sale Price | Title Company |
|---|---|---|---|
| Malinowski Kevin | -- | Solidifi Title & Closing Llc | |
| Malinowski Kevin | $184,900 | Title Co | |
| Bennett John R | $163,500 | Fm Title |
Source: Public Records
Mortgage History
| Date | Status | Borrower | Loan Amount |
|---|---|---|---|
| Open | Malinowski Kevin | $170,701 | |
| Closed | Malinowski Kevin | $175,655 | |
| Previous Owner | Bennett John R | $155,325 |
Source: Public Records
Tax History
| Year | Tax Paid | Tax Assessment Tax Assessment Total Assessment is a certain percentage of the fair market value that is determined by local assessors to be the total taxable value of land and additions on the property. | Land | Improvement |
|---|---|---|---|---|
| 2024 | $3,856 | $150,100 | $31,400 | $118,700 |
| 2023 | $4,086 | $141,600 | $31,400 | $110,200 |
| 2022 | $3,541 | $126,450 | $31,400 | $95,050 |
| 2021 | $3,173 | $114,950 | $31,400 | $83,550 |
| 2020 | $2,935 | $107,450 | $31,400 | $76,050 |
| 2019 | $2,938 | $107,450 | $17,450 | $90,000 |
| 2018 | $2,488 | $95,100 | $17,450 | $77,650 |
| 2017 | $2,391 | $92,350 | $17,450 | $74,900 |
| 2016 | $2,051 | $86,300 | $17,450 | $68,850 |
| 2015 | $2,187 | $86,300 | $13,100 | $73,200 |
| 2014 | $2,203 | $84,950 | $13,100 | $71,850 |
| 2013 | $2,100 | $80,900 | $13,100 | $67,800 |
Source: Public Records
Map
Nearby Homes
- 2925 Edgewood Dr N
- 2937 Edgewood Dr N
- 206 32nd Ave N
- 108 32nd Ave N
- 2510 Evergreen Rd N
- 301 21st Ave N
- 2939 Maple St N
- 21 35th Ave NE
- 35 S Woodcrest Dr N
- 305 19th Ave N
- 1830 4th St N
- 1905 9th St N
- 3521 Grandwood Dr N
- 3216 Broadway N
- 1645 Broadway N
- 1630 7th St N
- 1625 11th St N
- 1626 11th St N
- 1522 8th St N
- 1538 10th St N
- 2934 3rd St N
- 2926 3rd St N
- 2922 3rd St N
- 2938 3rd St N
- 2935 Edgemont St N
- 2939 Edgemont St N
- 2918 3rd St N
- 2929 3rd St N
- 2942 3rd St N
- 2933 3rd St N
- 222 29th Ave N
- 2931 Edgemont St N
- 2925 3rd St N
- 2943 Edgemont St N
- 2921 3rd St N
- 221 29th Ave N
- 2946 3rd St N
- 2914 3rd St N
- 2927 Edgemont St N
- 2917 3rd St N
Your Personal Tour Guide
Ask me questions while you tour the home.