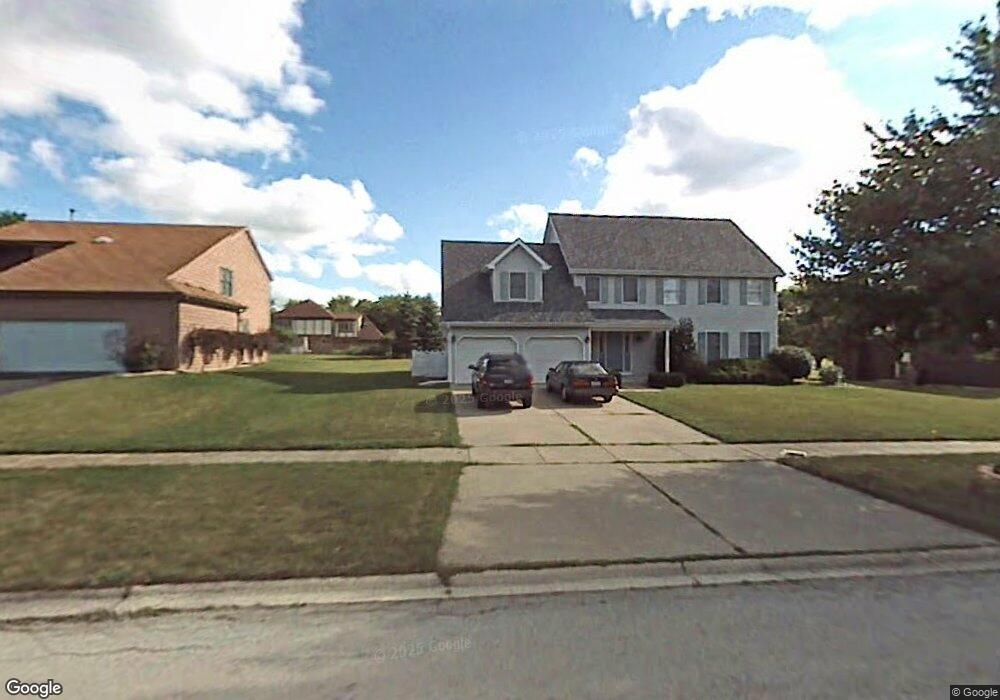
2930 Bonnie Brae Crescent Flossmoor, IL 60422
Estimated Value: $393,000 - $451,000
4
Beds
3
Baths
2,614
Sq Ft
$165/Sq Ft
Est. Value
About This Home
This home is located at 2930 Bonnie Brae Crescent, Flossmoor, IL 60422 and is currently estimated at $431,330, approximately $165 per square foot. 2930 Bonnie Brae Crescent is a home located in Cook County with nearby schools including Heather Hill Elementary School, Parker Junior High School, and Homewood-Flossmoor High School.
Ownership History
Date
Name
Owned For
Owner Type
Purchase Details
Closed on
Aug 27, 2021
Sold by
Higgins Dennis P and Higgins Kemiberly A
Bought by
Beals Bart E and Bcroadnax Beals Kurian
Current Estimated Value
Home Financials for this Owner
Home Financials are based on the most recent Mortgage that was taken out on this home.
Original Mortgage
$352,472
Outstanding Balance
$322,222
Interest Rate
3.12%
Mortgage Type
FHA
Estimated Equity
$109,108
Purchase Details
Closed on
Dec 29, 1997
Sold by
Mccarthy Martin J and Mccarthy Rose W
Bought by
Higgins Dennis P and Higgins Kimberly A
Home Financials for this Owner
Home Financials are based on the most recent Mortgage that was taken out on this home.
Original Mortgage
$183,200
Interest Rate
7.26%
Create a Home Valuation Report for This Property
The Home Valuation Report is an in-depth analysis detailing your home's value as well as a comparison with similar homes in the area
Home Values in the Area
Average Home Value in this Area
Purchase History
| Date | Buyer | Sale Price | Title Company |
|---|---|---|---|
| Beals Bart E | $385,000 | North American Title Company | |
| Higgins Dennis P | $229,000 | -- |
Source: Public Records
Mortgage History
| Date | Status | Borrower | Loan Amount |
|---|---|---|---|
| Open | Beals Bart E | $352,472 | |
| Previous Owner | Higgins Dennis P | $183,200 |
Source: Public Records
Tax History Compared to Growth
Tax History
| Year | Tax Paid | Tax Assessment Tax Assessment Total Assessment is a certain percentage of the fair market value that is determined by local assessors to be the total taxable value of land and additions on the property. | Land | Improvement |
|---|---|---|---|---|
| 2024 | $14,046 | $33,000 | $6,905 | $26,095 |
| 2023 | $10,926 | $33,000 | $6,905 | $26,095 |
| 2022 | $10,926 | $20,316 | $5,964 | $14,352 |
| 2021 | $10,946 | $20,314 | $5,963 | $14,351 |
| 2020 | $10,486 | $20,314 | $5,963 | $14,351 |
| 2019 | $12,679 | $23,528 | $5,335 | $18,193 |
| 2018 | $10,421 | $23,528 | $5,335 | $18,193 |
| 2017 | $8,887 | $23,528 | $5,335 | $18,193 |
| 2016 | $8,744 | $19,007 | $4,708 | $14,299 |
| 2015 | $8,719 | $19,007 | $4,708 | $14,299 |
| 2014 | $8,583 | $19,007 | $4,708 | $14,299 |
| 2013 | $10,332 | $24,253 | $4,708 | $19,545 |
Source: Public Records
Map
Nearby Homes
- 2937 Kathleen Ln
- 1833 Pheasant Ct
- 3013 Mac Heath Crescent
- 2904 Athena Ct
- 2908 Athena Ct
- 20015 Delphi Dr
- 1402 Berry Ln
- 3045 Scott Crescent
- 3106 Hermes Dr
- 1248 Berry Ln
- 3232 Chestnut Dr
- 1248 Oakmont Ave
- 3415 Vollmer Rd Unit 308
- 3324 Oregon Trail
- 3427 Vollmer Rd Unit 209
- 1430 Brassie Ave
- 3118 Elaine Ct Unit 232
- 2931 Sunset Ave
- 3521 Park Place
- 3037 Candlewood Ct
- 2931 Bonnie Brae Crescent
- 2937 Bonnie Brae Crescent
- 2925 Bonnie Brae Crescent
- 2925 Bonnie Brae Crescent
- 2840 Harolds Crescent
- 2844 Harolds Crescent
- 2828 Harolds Crescent
- 2943 Bonnie Brae Crescent
- 2932 Bonnie Brae Crescent
- 2926 Bonnie Brae Crescent
- 2852 Harolds Crescent
- 2938 Bonnie Brae Crescent
- 2947 Bonnie Brae Crescent
- 2935 Lawrence Crescent
- 1735 Lawrence Crescent
- 2900 Harolds Crescent
- 2944 Bonnie Brae Crescent
- 2841 Harolds Crescent
- 2939 Lawrence Crescent
- 2829 Harolds Crescent